Revolutionize Your Trend Trading with the New Heiken Ashi Indicator
In financial trading, market noise is the ultimate enemy of consistency. Standard candlestick charts often display erratic price gaps, long wicks, and alternating colors that can trick retail traders into exiting profitable trends too early or jumping into false reversals. To combat this psychological trap, professional technical analysts rely on smoothed trend-following variations. The New Heiken Ashi indicator offers a highly optimized, modern iteration of this classic Japanese charting technique, engineered specifically to clarify Price Action on MetaTrader platforms.
The Math Behind the Smoothed Trend Formula
Traditional candlesticks focus strictly on the raw Open, High, Low, and Close (OHLC) prices of an asset within a specific timeframe. While accurate, this raw feed captures every minor uptick and panic sell, clouding the underlying market direction.
The New Heiken Ashi indicator modifies this behavior by using a moving average formula to calculate modified synthetic candlesticks. Each bar is mathematically linked to the average price of its predecessor:
- Heiken Ashi Close: Calculated as the average of the current bar's open, high, low, and close.
- Heiken Ashi Open: Derived from the average of the previous bar's open and close.
By processing price data through an exponential or smoothed moving average engine, the New Heiken Ashi indicator isolates the core trend. It eliminates the confusing intraday counter-moves that often trigger emotional stop-outs, helping you ride large market extensions with composure.
Reading the Visual Framework and Color Dynamics
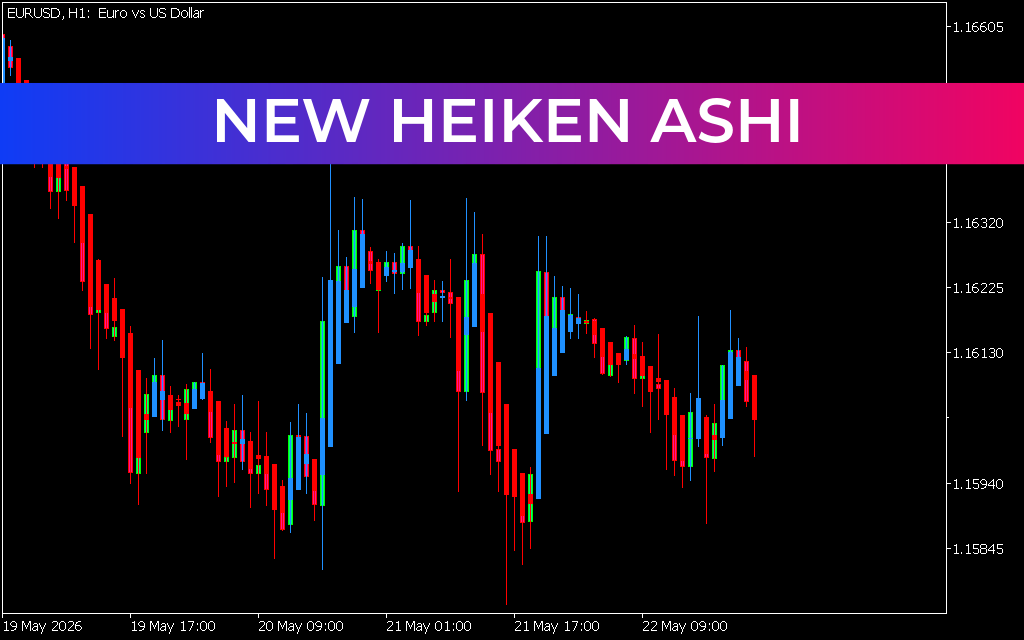
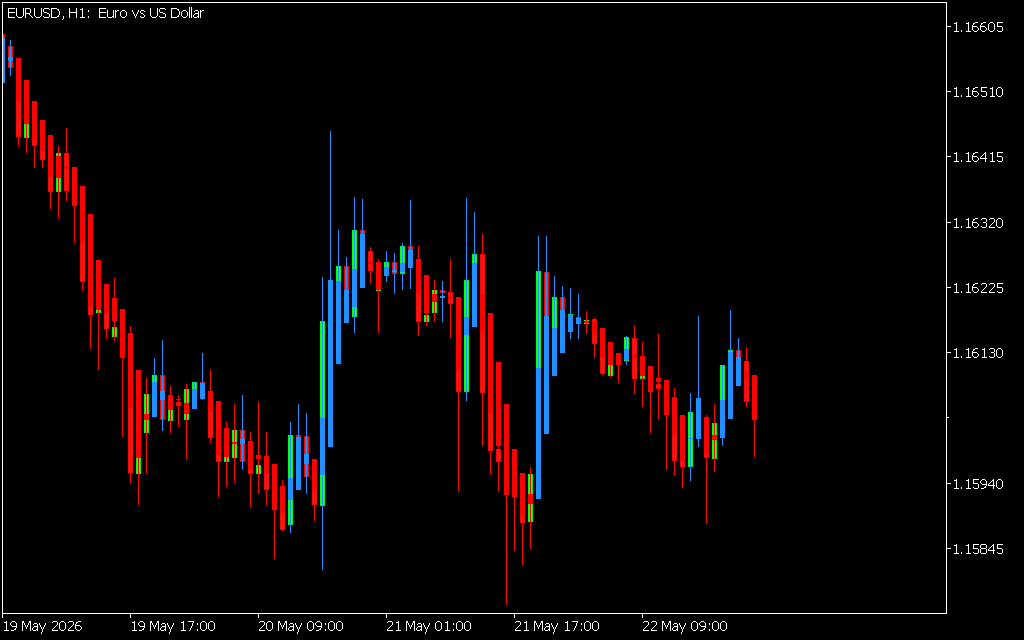
As displayed on the EURUSD H1 chart, the indicator transforms standard charts into a highly responsive, color-coded map overlayed directly on the price action. It completely replaces standard green and red bodies with specialized directional identifiers:
- Dominant Red Candles: Signal a healthy, mathematically backed markdown phase. As long as the candles print a solid red body with minimal upper wicks, institutional selling pressure remains firmly in control.
- Vibrant Blue/Cyan Candles: Represent a confirmed shift to bullish momentum. These bars highlight clear accumulation phases, providing an early signal that the path of least resistance is to the upside.
- Lime Green Transition Wicks: Act as visual filters that highlight key turning points or compression zones within an active trend.
This clear visual layout is exceptionally beneficial for day traders and swing traders alike. Instead of analyzing multiple complex candlestick configurations, a quick glance at the dominant color scheme tells you if you should be buying, selling, or remaining flat.
Developing a System Around Pure Market Flow
The New Heiken Ashi indicator functions as an outstanding standalone trend filter or as a foundation for a broader multi-indicator strategy. For example, trend-following traders can utilize it to scale into active positions. During a strong bullish run, minor pullbacks will not trigger a confusing color flip, allowing you to hold your position until a definitive structural shift occurs. By filtering out market static and eliminating manual drawing, this tool helps you execute your trading plan with flawless consistency and objective discipline.
2 Downloads
Last Update:
May 24, 2026 02:04 AM
Published:
Jan 15, 2026 20:19 PM
Category: