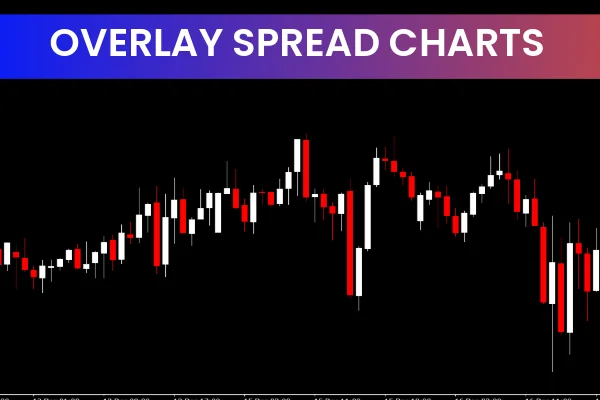
The Overlay Spread Charts indicator is a powerful and user-friendly tool for Forex traders, designed to enhance trading strategies by comparing the spread of two currency pairs signal on the same chart. It’s a free MT4 indicator that helps traders identify any discrepancies in the spread, enabling them to make more informed decisions and optimize their trading strategies.
Traders can easily customize the indicator to display various spread parameters, such as bid-ask spread, midpoint spread, and pip spread, all in a graphical format. This feature makes it easier to spot differences between currency pairs and quickly act on them. Levels Overlay Spread Charts Indicator?
The Overlay Spread Charts indicator overlays the spread of two currency pairs on the same chart, allowing traders to compare the spreads visually. This comparison is crucial, as the spread can vary between currency pairs, and identifying discrepancies may provide traders with a competitive advantage.
By comparing the spreads, traders can:
Spot anomalies in spreads
Compare liquidity between pairs
Find the best pairs for trading at any given time
The indicator provides a clear and simple way to visualize the spreads, making it an essential tool for any trader seeking to gain an edge in the Forex market.
How the Overlay Spread Charts Indicator Works
Once installed, the Overlay Spread Charts indicator allows traders to compare the spread of two currency pairs on the same chart. Here’s how it works:
Setup
Select the two currency pairs you wish to compare
The indicator will automatically display the spread for each pair
Customize the display options (e.g., bid-ask spread, midpoint spread, pip spread)
This functionality makes it straightforward for traders to compare two pairs side-by-side, without needing to switch between multiple charts.
Visual Comparison of Spreads
The overlay provides a graphical display of the spreads, so traders can immediately see how they compare. The spread is typically shown as a line or band on the chart, helping traders visually identify when one pair has a significantly higher or lower spread than the other.
Key Features of the Overlay Spread Charts Indicator
The Overlay Spread Charts indicator is packed with features that enhance the trading experience. Some of its key features include:
Bid-Ask Spread: Displays the difference between the buying and selling price for both currency pairs
Midpoint Spread: Shows the difference between the midpoint of the bid-ask spread for comparison
Pip Spread: Measures the spread in terms of pips
Graphical Display: Visual representation of the spread on the chart for easy comparison
Traders can use these spread parameters to analyze market conditions, identify the most favorable pairs to trade, and avoid those with unusually wide spreads, which may result in higher trading costs.
Why Use the Overlay Spread Charts Indicator?
The Overlay Spread Charts indicator is especially useful in the following situations:
Identify Spread Discrepancies
By comparing the spreads of two currency pairs, traders can quickly spot discrepancies. For example, if one currency pair has a significantly wider spread than another, it could indicate lower liquidity or higher volatility, both of which can affect trading outcomes.
Optimize Trading Costs
The spread is an important cost of trading, as it directly impacts profitability. By using the Overlay Spread Charts indicator, traders can find currency pairs with tighter spreads, minimizing their trading costs and improving their overall trading efficiency.
Compare Liquidity Between Pairs
Spreads are often wider for pairs with lower trend liquidity. The indicator helps traders assess liquidity between currency pairs, enabling them to select the most liquid pairs for trading.
How to Use the Overlay Spread Charts Indicator Effectively
To make the most of the Overlay Spread Charts indicator, traders should keep the following tips in mind:
Monitor during high volatility: Spreads can widen during high volatility or news events, making it important to keep an eye on spreads during such times.
Use alongside other indicators: While spread analysis is helpful, combining this tool with other technical indicators can improve decision-making and trade timing.
Use multiple timeframes: Comparing spreads across different timeframes can give a broader perspective on market conditions and liquidity.
By integrating the Overlay Spread Charts indicator with a solid trading strategy, traders can gain valuable insights into the cost structure of their trades and make more informed decisions.
Conclusion
The Overlay Spread Charts indicator is a simple yet powerful tool for Forex traders using the MT4 platform. It allows traders to compare the spreads of two currency pairs side by side, helping them identify discrepancies, optimize trading costs, and improve their decision-making. Free to download and easy to use, this indicator is a must-have for anyone looking to enhance their Forex trading toolkit.
To get started with the Overlay Spread Charts indicator, visit IndicatorForest.com and download it for free today.
FAQ
Overlay Spread Charts displays the spread (difference between bid and ask prices) directly on price charts. It helps traders see spread costs and identify when spreads are favorable for trading.
Spread information shows trading costs, helps identify best times to trade (when spreads are tight), warns when spreads are too wide, and assists in choosing optimal entry/exit times to minimize costs.
Avoid trading when spreads are unusually wide, enter trades when spreads are tight, use spread data to calculate true entry/exit prices, and consider spread costs in your risk management.
Spread awareness helps minimize trading costs, identifies optimal trading times, improves trade profitability by reducing spread costs, and provides important information for trade planning.
Use spread data to time entries and exits, factor spread costs into profit targets, avoid trading during wide spread periods, and combine spread awareness with your trading strategy.
Published:
Dec 17, 2025 00:32 AM
Category: