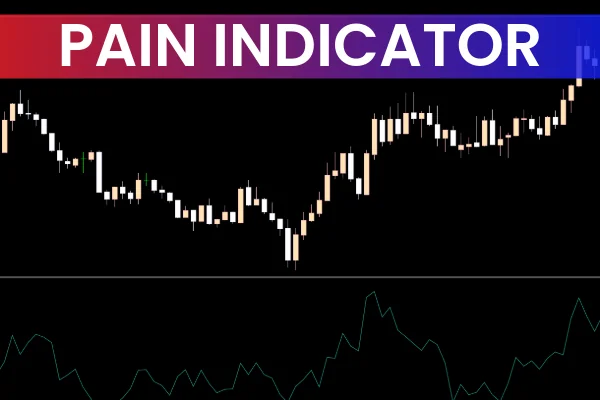
The Pain Indicator is a technical analysis tool developed for the MetaTrader 5 platform. It monitors price volatility, evaluates market sentiment, and predicts potential trend directions. This indicator gives traders insight into how a group of market participants feels about the current state of an asset and helps anticipate the next possible price movement.
The Pain Indicator works effectively in all market conditions. In trending markets, it identifies price pullback areas to join the current trend, while in sideways markets, it provides clues about potential breakout directions.
How the Pain Indicator Works
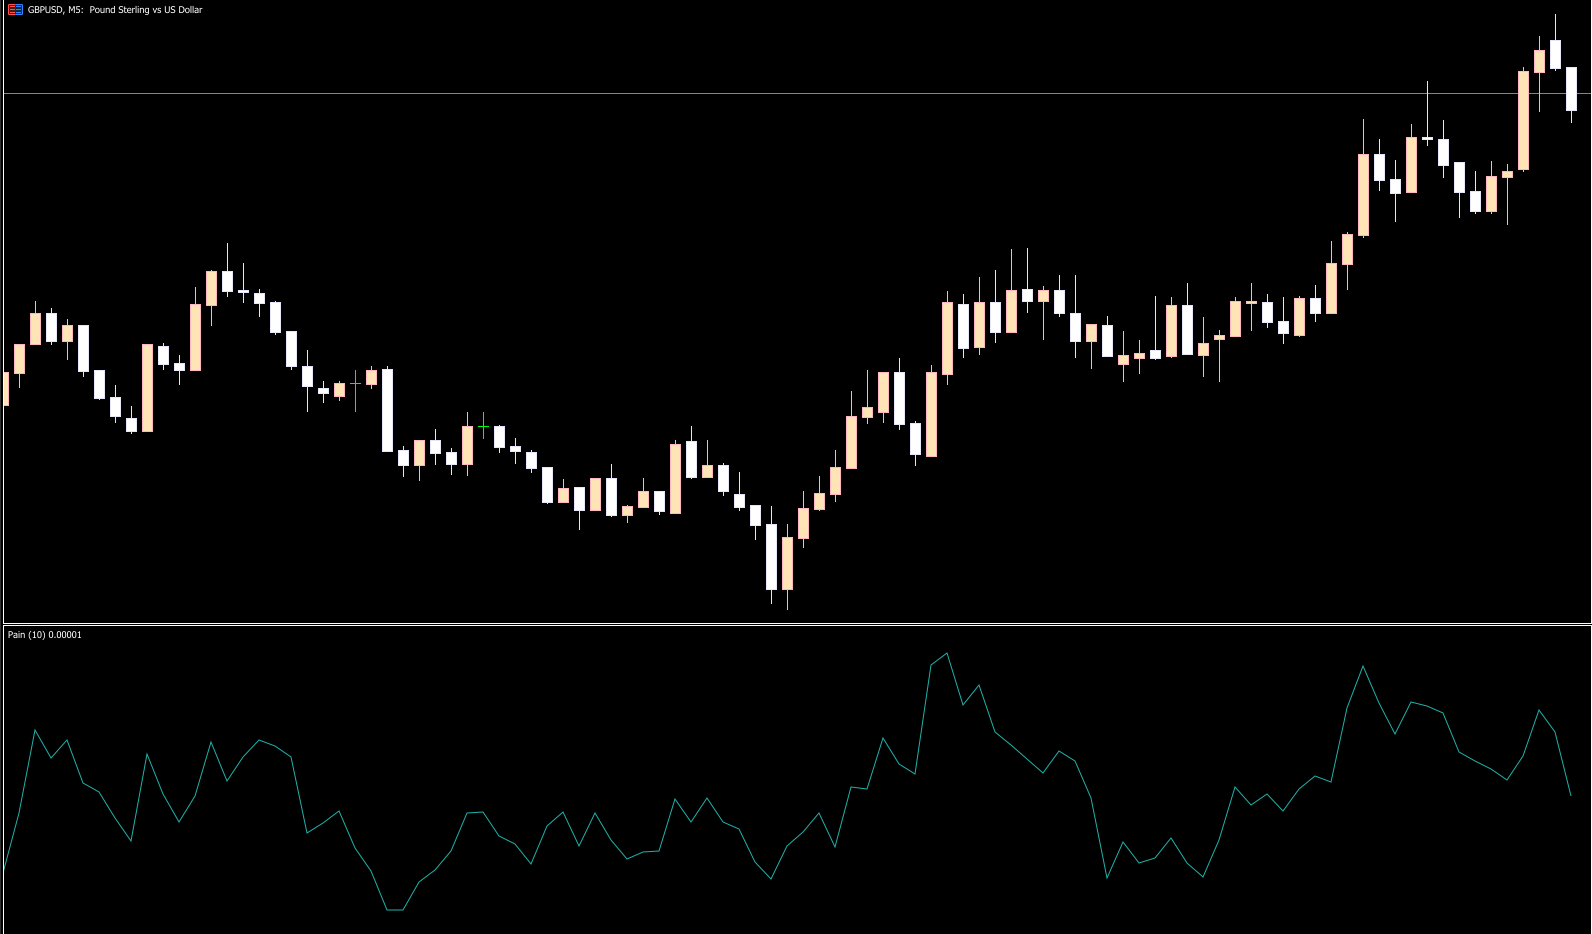
The Pain index value is calculated based on the profit and loss of the price over a specified period.
Bullish Trend – The indicator line moves upward, signaling strong buying pressure.
Bearish Trend – The indicator line moves downward, reflecting selling pressure.
While the Pain Indicator does not provide direct buy/sell or reversal signals, traders can analyze swing levels and the direction of the indicator line to gauge the strength of bullish or bearish sentiment behind price movements.
Practical Example
On the EURUSD chart, the Pain Indicator gradually increased following a bullish trend. By drawing a trend line in the indicator window, it’s clear that the line forms higher lows during pullbacks, reflecting the ongoing bullish sentiment. Each time the price breaks out of a consolidation range, the Pain Indicator fluctuates upward, indicating a continuation of the current trend.
Conclusion
The Pain Indicator helps traders study the balance between bullish and bearish forces behind Price Action. While market sentiment can be influenced by technical and fundamental factors such as news events or support/resistance breakouts, the Pain Indicator simplifies the analysis of market power. Beginners and experienced traders alike can benefit from understanding overall market sentiment before making trading decisions.
FAQ
5 Downloads
Published:
Dec 07, 2025 11:01 AM
Category: