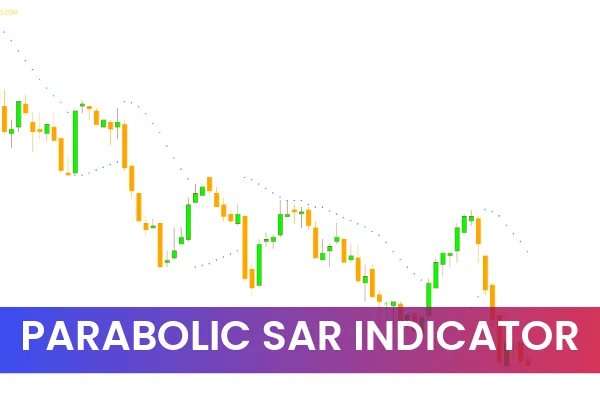
The Parabolic SAR Indicator is a classic MT4 tool developed by J. Wilder to help traders identify market trends and potential reversals. By plotting dotted lines above or below Price Action, the indicator provides a clear visual representation of trend direction, making it easier to determine BUY and SELL opportunities.

How the Parabolic SAR Indicator Works
The indicator places dots that move along the trend:
Dots below the price indicate an uptrend. Traders can consider entering long positions or exiting short trades.
Dots above the price indicate a downtrend. Traders may enter short positions or close long trades.
The dots adjust dynamically with the trend, staying below the price during an uptrend and above it during a downtrend. This makes it easy to visualize the current market momentum.
Best Practices for Trading with Parabolic SAR
Timeframes: While it can be applied on any timeframe, longer timeframes (H4, Daily) reduce market noise and improve signal reliability.
Combine with Moving Averages: Using Parabolic SAR alongside moving averages enhances trend confirmation and helps avoid false signals.
Entry and Exit Points: Look for trend reversals indicated by the dots shifting position to determine optimal entry or exit points.
Advantages of Using Parabolic SAR Indicator
Simple to Use – Easy visual signals make trend identification straightforward.
Works on Any Timeframe – Flexible for Scalping, day trading, or swing trading strategies.
Improves Decision-Making – Helps traders time entries and exits more effectively.
Free to Download – Accessible without cost for MT4 users.
Conclusion & Call-to-Action
The Parabolic SAR Indicator for MT4 is a reliable tool to detect trends and reversals in the forex market. By analyzing the position of the dotted lines relative to price action, traders can identify high-probability BUY and SELL opportunities. Download the Parabolic SAR indicator for free on IndicatorForest.com and start improving your trading strategy today.
FAQ
2 Downloads
Published:
Nov 13, 2025 23:48 PM
Category: