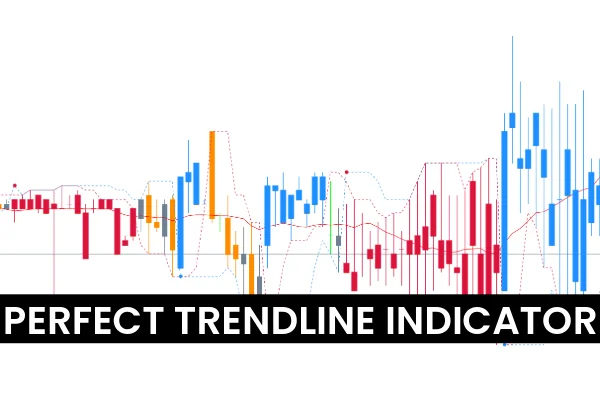
The Perfect Trendline Indicator MT5 is a powerful trend-following tool that helps forex traders identify clear BUY and SELL signals using two trendlines and color-coded dots. This indicator is designed for traders who want an easy-to-read, visual method of understanding trend momentum and market direction. By combining trendlines, colored candles, and signal dots, the Perfect Trendline Indicator gives traders an accurate interpretation of bullish and bearish conditions without unnecessary complexity.
This guide explains how the indicator works, how to use its signals, and why it is one of the most reliable MT5 trend tools available. You can download this indicator for free at IndicatorForest.com.
How the Perfect Trendline Indicator MT5 Works
The Perfect Trendline Indicator displays two trendlines:
Fast Trendline
Slow Trendline
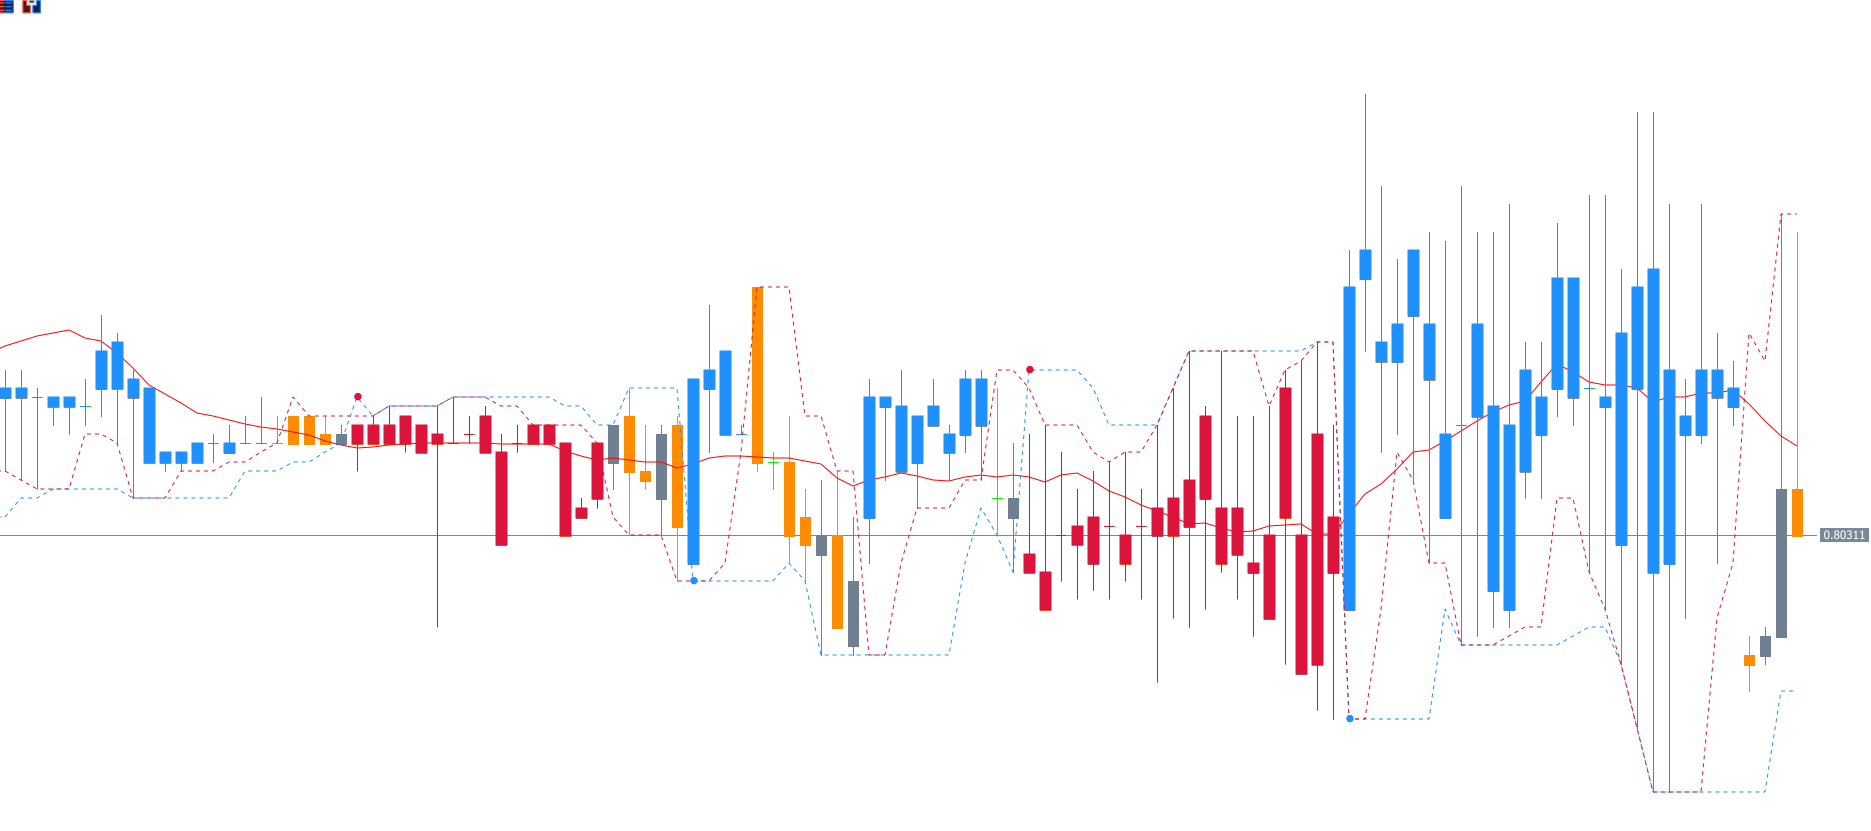
These lines determine the current market direction. When the fast trendline crosses above the slow one, it suggests increasing bullish momentum. When the fast line drops below the slow line, bearish sentiment begins to dominate.
Color-Coded Trend Dots
The indicator also plots dots that act as direct trading signals:
Blue dot = BUY signal
Red dot = SELL signal
These dots appear at key turning points in price, giving traders an early alert of potential trend reversals or momentum shifts.
Colored Candlestick Visualization
To make trend reading even simpler, the Perfect Trendline Indicator colors the chart candles:
Blue candles = Bullish market momentum
Red candles = Bearish market momentum
During ranging or neutral conditions, the indicator leaves candles uncolored, helping traders avoid low-quality setups.
Perfect Trendline Indicator BUY & SELL Signals
The Perfect Trendline Indicator MT5 performs extremely well on higher timeframes like H4 and Daily charts, where price patterns are cleaner and false signals are minimal.
BUY Signal Conditions
A valid long entry occurs when:
A blue dot appears under the price.
The blue trendline crosses above the red trendline.
Candle color confirms bullish sentiment.
This combination indicates rising momentum and a possible uptrend continuation.
SELL Signal Conditions
A valid short entry occurs when:
A red dot appears above the price.
The red trendline crosses above the blue trendline.
Candles turn red, signaling bearish control.
These confirmations together highlight strong downward pressure.
Exit Signals
Exits are also straightforward:
Blue dot = exit SELL (bearish trend weakening)
Red dot = exit BUY (bullish trend weakening)
Sometimes, dots may appear during temporary pullbacks. These short-term fluctuations do not always reflect a complete reversal, so traders should confirm signals using the trendlines and candle colors.
What Is an Ideal Trend Line?
An ideal trendline is one that visually represents the dominant direction of price movement. The Perfect Trendline Indicator combines fast and slow trendlines to capture:
Overall trend direction
Momentum strength
Shift in market sentiment
This makes trendline trading more precise, especially for traders who struggle to draw trendlines manually.
Why Use the Perfect Trendline Indicator MT5?
The indicator is useful for:
Beginner traders learning trend trading
Swing traders analyzing higher timeframe trends
Intraday traders filtering fake signals
Anyone needing simple, visual buy/sell confirmations
Its high accuracy, minimal lag, and easy-to-read layout make it one of the most user-friendly MT5 trend indicators available.
Conclusion
The Perfect Trendline Indicator MT5 provides clear BUY and SELL signals using trendlines, colored dots, and candle visualization. It helps traders identify Trend Strength, momentum shifts, and ideal entry and exit points with confidence. Whether you are new to forex or an experienced trader, this indicator can enhance your decision-making process and simplify your chart analysis.
You can download the Perfect Trendline Indicator for MT5 free at IndicatorForest.com, along with many other premium-quality forex indicators.
FAQ
1 Download
Published:
Nov 28, 2025 21:02 PM
Category: