Navigating Daily Market Trends with Pivot Indicators
In the mathematical world of financial trading, finding objective structural Support And Resistance levels is a top priority for consistent risk management. Many retail traders clutter their charts with subjective trendlines or lag-heavy indicators that obscure raw price action. To bring institutional-grade clarity to their layouts, professional technical analysts rely on mathematical price anchors. For MetaTrader users, Pivot Indicators serve as the definitive tool for automating this intraday mapping process.
By automatically calculating and plotting critical price boundaries derived from previous session data, this utility helps day traders and scalpers find high-probability turning points without manual calculation.
The Power of Floor Pivot Points
The foundational concept behind Pivot Indicators is rooted in Floor Pivot equations, which calculate a central balance point using the previous period's high, low, and close values. This central pivot line acts as the market's primary equilibrium zone for the current session.
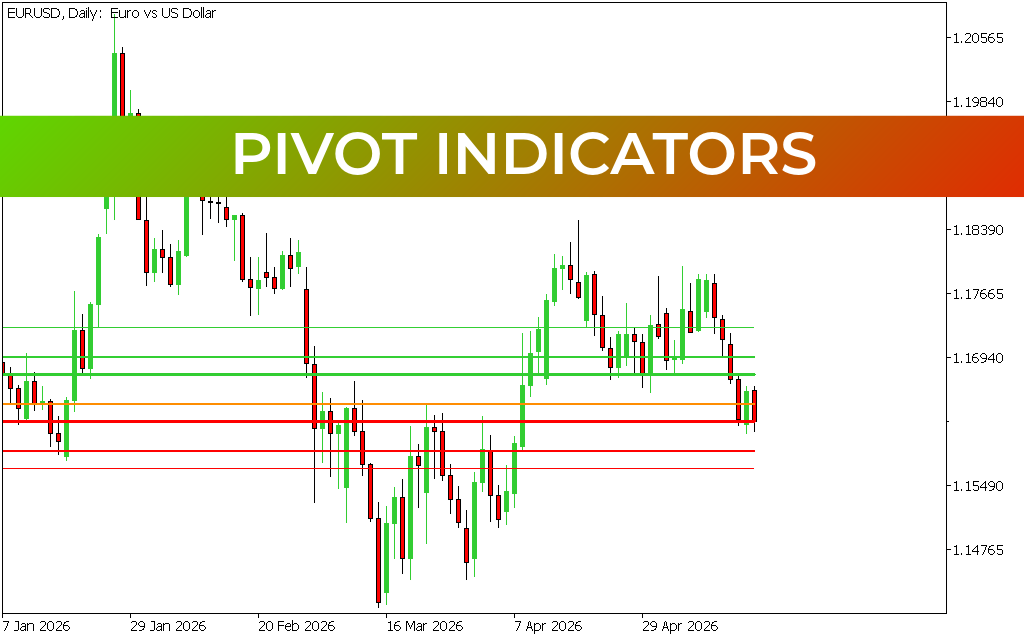
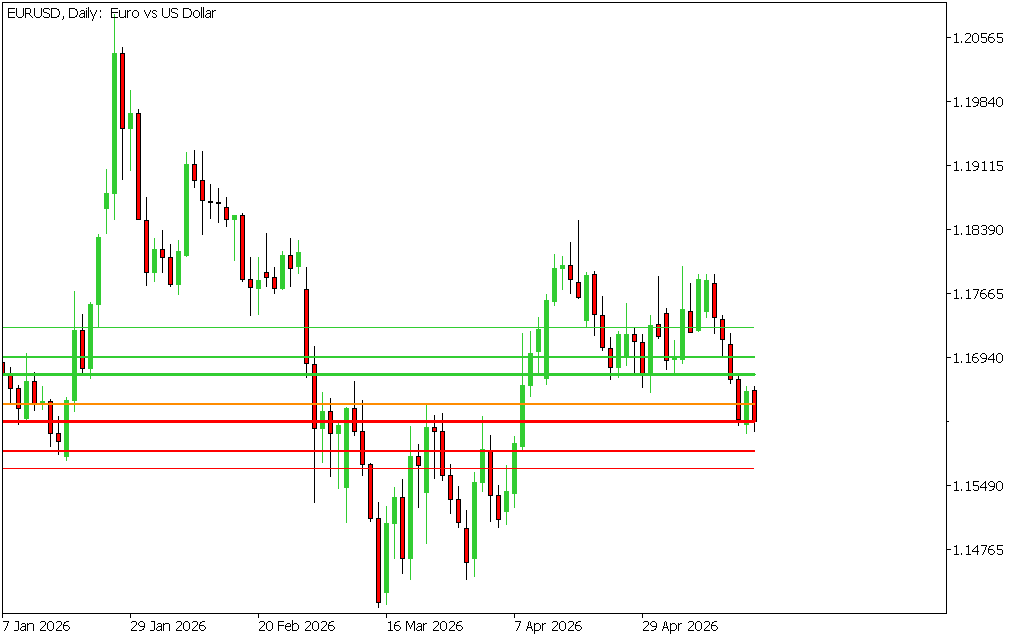
As demonstrated on the macro Daily (Daily) chart template, the indicator automatically projects a structured matrix of horizontal target levels:
- The Central Pivot Line: Serves as the day's baseline. Trading above it dictates a near-term bullish bias, while trading below establishes a bearish outlook.
- Resistance Lines (Green Levels): Plot upper zones where selling pressure or profit-taking typically increases.
- Support Lines (Red Levels): Plot lower structural floors where institutional buyers often seek value.
Because these horizontal levels are static throughout the trading window, they act as psychological self-fulfilling prophecies, heavily monitored by high-frequency algorithms and bank traders alike.
Key Technical Trading Strategies
Integrating automated Pivot Indicators into an active trading layout provides a mechanical approach to navigating liquid pairs like the EUR/USD.
1. Intraday Reversal Trading
During typical trading conditions, the market rarely moves in a straight line through all levels. Scalpers monitor the outermost red support or green resistance boundaries for exhaustion patterns. If price drives aggressively down to a primary red support line and prints a clean rejection candle, it provides a low-risk opportunity to trade a corrective bounce back toward the central balance line.
2. Pivot Breakout Continuations
When major macroeconomic news or fundamental data enters the market, Price Action can break forcefully past standard ranges. A decisive, high-volume candle close above a primary resistance level confirms a strong breakout phase. Trend traders use this breakout signal to buy into the momentum, using the next higher pivot line as a precise take-profit target.
3. Dynamic Stop Placement
Beyond entry strategies, these mathematical lines offer an excellent mechanical framework for risk management. When entering a position at a pivot bounce, traders can place their defensive stop-losses safely behind the next structural pivot level, ensuring their capital is protected by hard market floors.
Streamline Your Chart Structure
Pivot Indicators are an essential upgrade for any serious technical analyst who wants to eliminate guesswork from their workspace. By transforming historical price data into an automated, objective map of intraday support and resistance, this tool ensures you execute trades with structural confidence across any timeframe.
3 Downloads
Last Update:
May 19, 2026 16:05 PM
Published:
Jan 19, 2026 19:48 PM
Category: