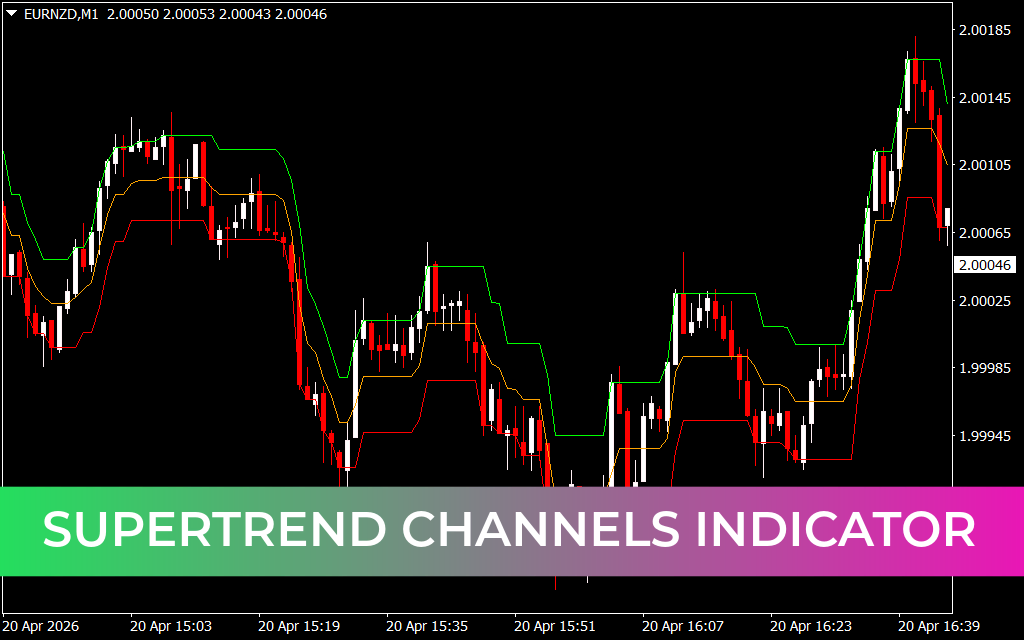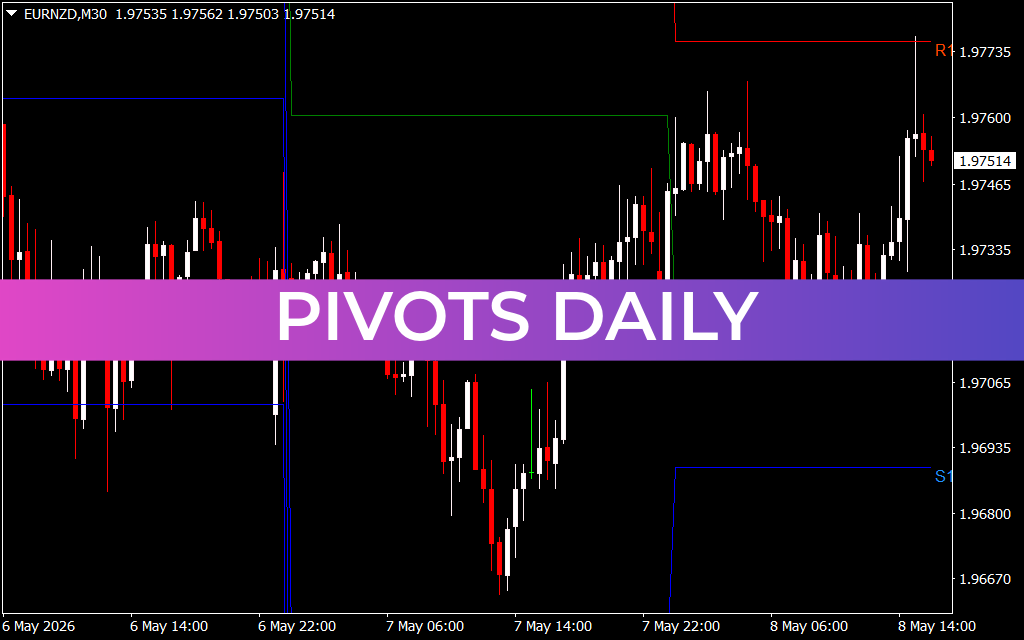
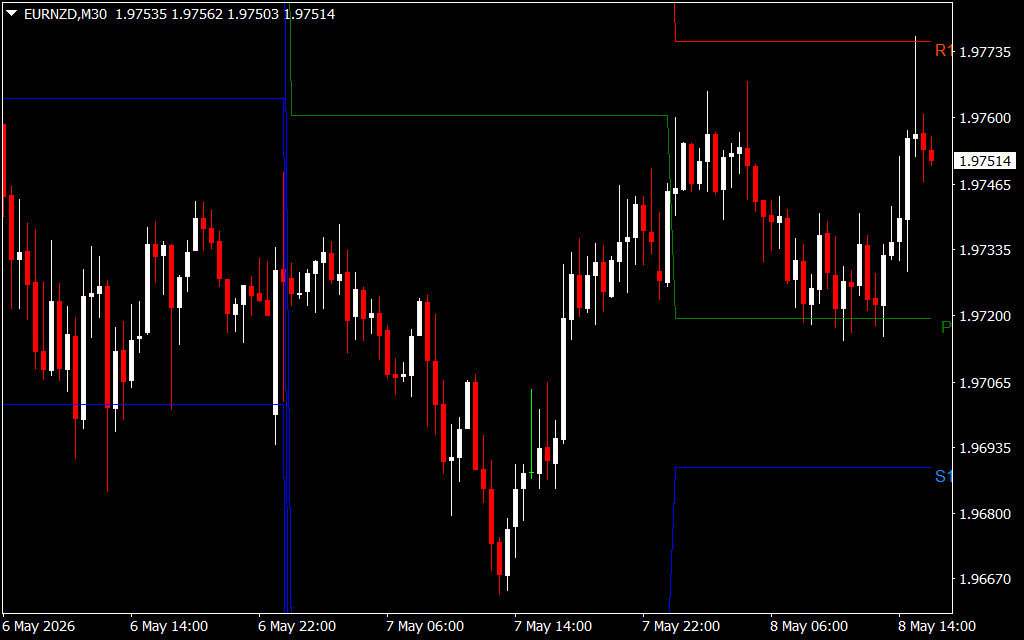
The provided chart showcases the Pivots Daily indicator applied to the EURNZD pair on a 30-minute (M30) timeframe. This tool automatically plots critical institutional levels—including the central Pivot Point (P), Resistance (R1), and Support (S1)—providing a clear roadmap for daily Price Action and potential reversal zones.
Mastering the Markets with the Pivots Daily Indicator
In the world of professional trading, floor pivots are considered the "GPS" of the market. While retail traders often clutter their charts with lagging oscillators, institutional desk traders rely on mathematical price levels derived from the previous day's high, low, and close. The Pivots Daily indicator for MetaTrader 4 (MT4) automates this calculation, providing you with the exact price coordinates where the "big money" is likely to react.
What is the Pivots Daily Indicator?
Pivots Daily is a predictive technical analysis tool that projects horizontal Support And Resistance lines onto your current chart. The central Pivot Point (P) serves as the primary trend filter: trading above the pivot suggests a bullish daily bias, while trading below it indicates bearish sentiment. Surrounding this central line are multiple levels of Support (S) and Resistance (R), which act as natural profit targets and entry zones.
Why Institutional Traders Use Pivots
- Objective Price Levels: Unlike subjective trendlines, pivot points are calculated using a fixed formula. This means thousands of traders are looking at the exact same price levels, creating a self-fulfilling prophecy of market reactions.
- Daily Roadmap: At the start of every trading session, Pivots Daily gives you a clear plan. You know exactly where to look for "bounces" and where to anticipate "breakouts."
- Dynamic Risk Management: These levels provide logical locations for stop-loss placement. For example, a common strategy involves placing a stop-loss just behind the central pivot when trading a move toward R1.
- Confluence Discovery: When a Pivot level aligns with a moving average or a Fibonacci retracement, the probability of a successful trade increases significantly.
Strategic Application: How to Trade Pivots
As seen on the M30 chart, price often treats these levels as "magnets." Traders typically look for two types of setups:
- The Pivot Bounce: Looking for reversal candlestick patterns (like pin bars or engulfing candles) when price touches a Support or Resistance level.
- The Pivot Breakout: If price breaks through the central Pivot Point with high volume, it often signals a move toward the next major level (R1 or S1).
For intraday traders and scalpers, the Pivots Daily indicator is essential for maintaining perspective. It prevents you from "buying the top" at a Resistance level or "selling the bottom" at a Support level. By identifying the institutional "battlegrounds" before the session begins, you can position yourself alongside the smart money.
2 Downloads
Last Update:
May 08, 2026 19:08 PM
Published:
Jan 25, 2026 21:55 PM
Category: