Navigating Intraday Micro-Trends with Polarized Fractal Efficiency
Trading highly volatile, lower timeframes like the 1-minute (M1) chart requires deep structural clarity. On high-frequency setups, liquid currency pairs like the EUR/USD frequently loop through rapid transitions. Price moves quickly from tight, sideways accumulation zones to explosive, directional expansions. For active day traders and scalpers, the primary technical challenge is determining whether a sharp move is a sustainable, linear trend or a chaotic, low-volume spike destined for an immediate reversal.
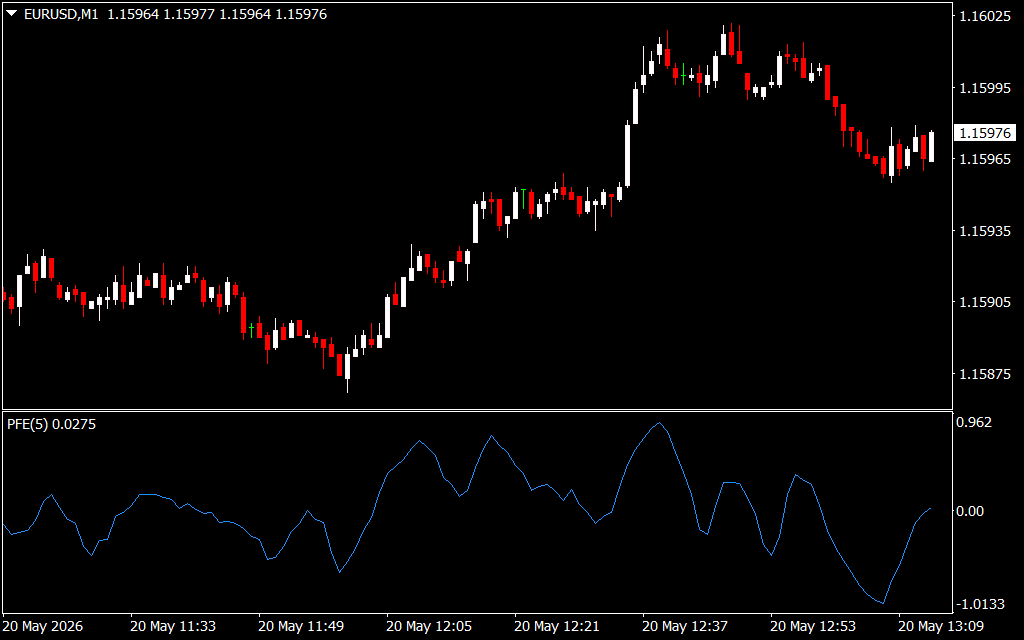
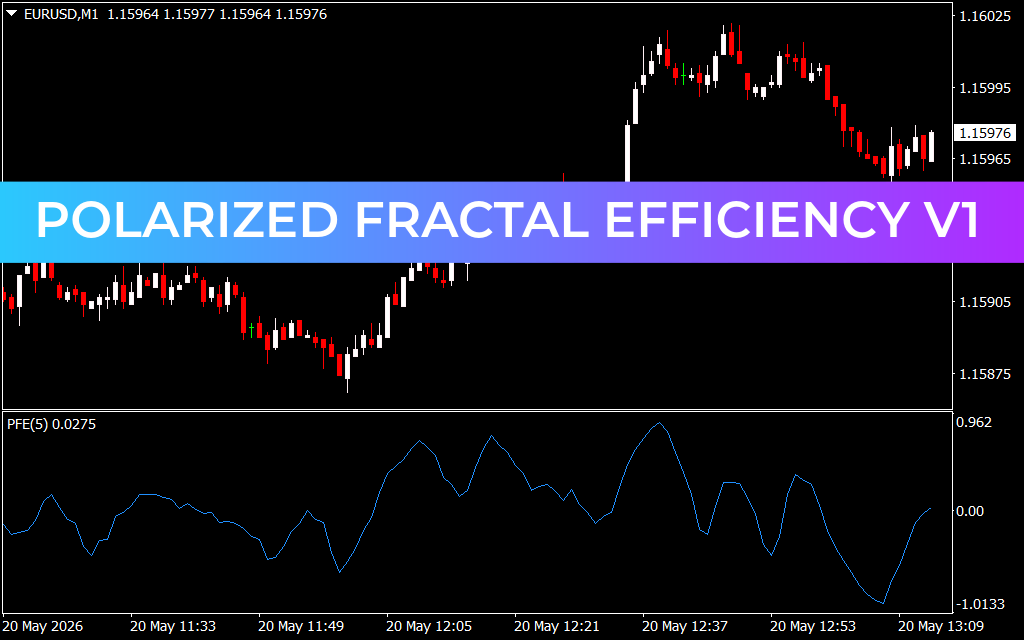
Looking closely at the EUR/USD M1 price delivery across this session, the asset prints a distinct fractal pattern. Price distributed from local peaks near 1.15940, sliding downward in a choppy sequence to sweep minor buy-side liquidity at a structural floor of 1.15870. Right after this exhaustive drop, institutional volume surged, triggering an aggressive, near-vertical markup phase that rocketed price back up to test the 1.16010 resistance level.
To systematically separate trending efficiency from non-directional market chaos on these ultra-low timeframes, professional traders rely on the Polarized Fractal Efficiency V1 system.
The Mathematics of Measuring Trend Linearity
Developed to apply chaos theory and fractal geometry to financial markets, Polarized Fractal Efficiency (PFE) measures how efficiently price moves between two points over a specified lookback period. If price moves in a straight, direct path, the market is operating at maximum efficiency. If price moves erratically with heavy friction and overlapping wicks, the market is highly inefficient and bound to a range.
When mapped directly below the fast-moving M1 candles, this advanced mathematical script translates price efficiency into an actionable oscillator sub-window:
- Quantifying Strong Volatility: The indicator features a central equilibrium zero-line with upper and lower boundary thresholds (typically at +50 and -50). During the explosive vertical rally from 11:55 onward, the tracking line hooks sharply upward toward the upper efficiency zone. This confirms that the immediate buying velocity is highly linear, instructing scalpers to hold onto long positions for maximum pip gains.
- Spotting Overextended Reversal Zones: When the oscillator line crosses above the upper +50 threshold, it flags overextended structural efficiency. This signals that the immediate trend expansion has exhausted its geometric energy and is likely to stall, giving traders an objective exit target or an early warning to look for short counter-trend entries.
Streamlining Workspace Efficiency
Relying purely on standard lagging indicators like basic moving averages on an M1 chart introduces execution delays and emotional bias. Incorporating a non-linear efficiency filter directly onto your platform standardizes your rules for trade entry and risk containment. The customizable backend parameters within this custom utility allow you to fine-tune lookback lengths, alter smoothing coefficients to match your personal strategy, and activate real-time notifications the exact moment an efficiency boundary is broken. Integrating this professional script into your MetaTrader infrastructure provides an undeniable technical edge—allowing you to confidently ignore market noise and trade in perfect sync with institutional order flow.
1 Download
Last Update:
May 20, 2026 16:15 PM
Published:
Jan 18, 2026 17:48 PM
Category: