The PPO Indicator for MT4 (Percentage Price Oscillator) is a powerful momentum-based technical indicator that helps traders identify market trends, reversals, and divergences. It works similarly to the popular MACD indicator, but instead of using the absolute difference between moving averages, it calculates the percentage difference. This small but crucial variation makes the PPO indicator more adaptable across various instruments and timeframes.
Because it is normalized as a percentage, the PPO allows easier comparison of momentum between different assets—making it a preferred choice for traders who analyze multiple currency pairs or financial instruments. Whether you’re a new trader learning trend-following strategies or an advanced trader developing algorithmic systems, the PPO indicator is a versatile tool suitable for all experience levels.
How the PPO Indicator for MT4 Works
The PPO Indicator calculates the difference between two Exponential Moving Averages (EMAs)—typically a short-term and a long-term average—and then expresses that difference as a percentage of the longer EMA. The formula provides a relative measure of momentum, allowing the indicator to perform more consistently across markets with varying price scales.
The PPO consists of three main components:
PPO Line: The percentage difference between two EMAs (usually 12-period and 26-period).
Signal Line: A 9-period EMA of the PPO line used to confirm buy/sell signals.
Histogram (optional): Displays the difference between the PPO line and the signal line for clearer visualization of momentum shifts.
This setup helps traders determine not only the direction of the trend but also the strength and momentum behind it.
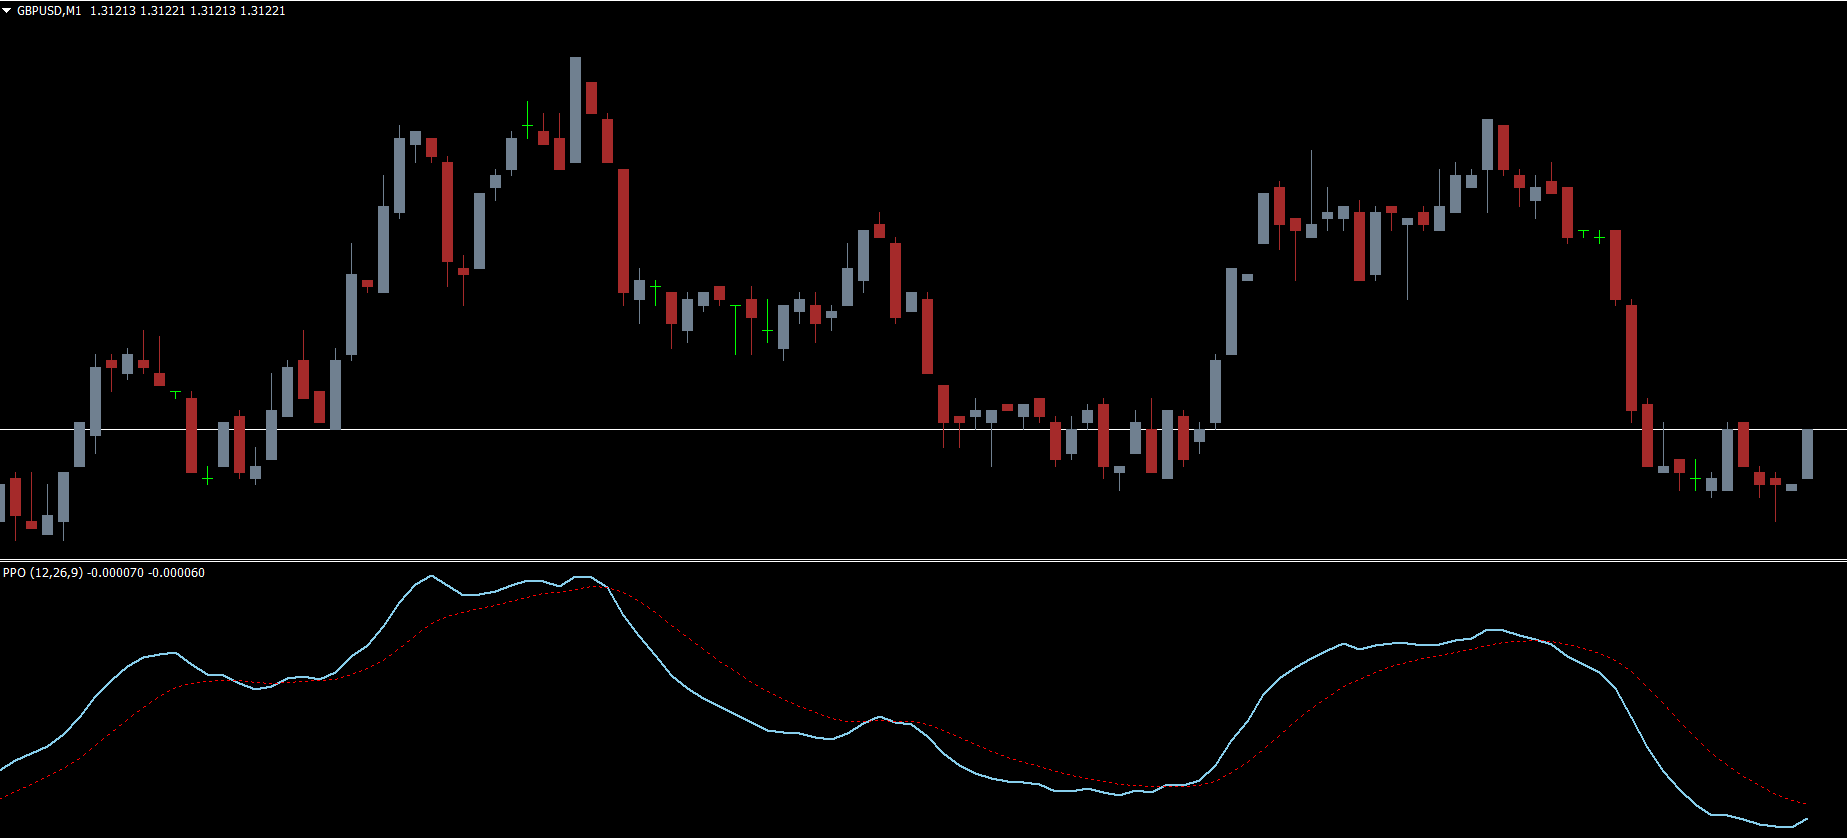
PPO Indicator for MT4 Trading Signals
The GBP/USD H1 chart shown above demonstrates how the PPO Indicator works in live market conditions. Traders can interpret the signals in several ways:
PPO and Signal Line Crossover
When the PPO line crosses above the Signal line, it generates a bullish signal, suggesting upward momentum. Traders can place a buy trade with a stop loss below the recent swing low.
Conversely, when the PPO line crosses below the Signal line, it produces a bearish signal, indicating downward momentum. Traders can enter a sell trade with a stop loss above the recent swing high.
Zero Line Crossover
A PPO line crossing above the Zero line confirms a bullish trend, showing that short-term momentum is stronger than long-term momentum.
A PPO line crossing below the Zero line confirms a bearish trend, signaling that downward momentum is increasing.
These zero-line crossovers are useful for identifying long-term market direction and aligning trades with the dominant trend.
Divergence and Convergence
Bullish Divergence: When price forms lower lows while the PPO forms higher lows, it signals weakening bearish momentum—potentially a reversal to the upside.
Bearish Divergence: When price forms higher highs while the PPO forms lower highs, it signals fading bullish momentum—often preceding a downward move.
Divergences often occur before the actual price reversal, making the PPO indicator a leading indicator in many situations. Traders can use this feature to time entries more precisely and improve reward-to-risk ratios.
Why Use the PPO Indicator for MT4
The PPO indicator offers several key advantages:
Normalized Momentum Measurement: Expresses values in percentages, making it comparable across assets.
Identifies Early Trend Shifts: Through signal and zero-line crossovers.
Detects Divergences: Provides early warnings of potential reversals.
Works Across All Timeframes: From intraday (M5, M15) to long-term charts (H4, D1, W1).
Easy Installation: The indicator is free to download and simple to install on MetaTrader 4.
Because the PPO Indicator measures relative momentum, it adapts well to both volatile and steady markets, helping traders identify optimal entry and exit points regardless of instrument type.
Limitations and Best Practices
While the PPO Indicator is highly effective, it shares some limitations with the MACD, such as lag during rapid price movements. Therefore, traders should confirm PPO signals with additional indicators like RSI, Stochastic Oscillator, or Moving Averages.
Combining PPO with Price Action patterns or support/resistance levels can significantly enhance accuracy and reduce false signals. For algorithmic or automated trading systems, PPO can serve as a core component for momentum-based strategies when paired with proper filters.
Conclusion
The PPO Indicator for MT4 is a robust and percentage-based version of the classic MACD, offering improved comparability and adaptability across instruments. It enables traders to analyze momentum, spot divergences, and trade trend reversals with precision.
However, just like any technical tool, traders should use PPO signals in conjunction with other confirmation indicators or Market Structure analysis for best results. With its clear crossovers and percentage-based scaling, the PPO Indicator provides a balanced blend of simplicity, accuracy, and depth—making it a must-have addition to any trader’s MT4 toolkit.
FAQ
1 Download
Published:
Nov 12, 2025 23:32 PM
Category: