Master Volatility with the Price Change Indicator for MT4 and MT5
In the world of financial trading, the speed and magnitude of market movement are often more important than the direction itself. For traders who need to quantify momentum in real-time, the Price Change Indicator is an indispensable tool. Unlike traditional lagging indicators, the Price Change tool provides a raw, mathematical look at how much the price has moved over a specific period, allowing you to gauge market volatility with surgical precision.
What is the Price Change Indicator?
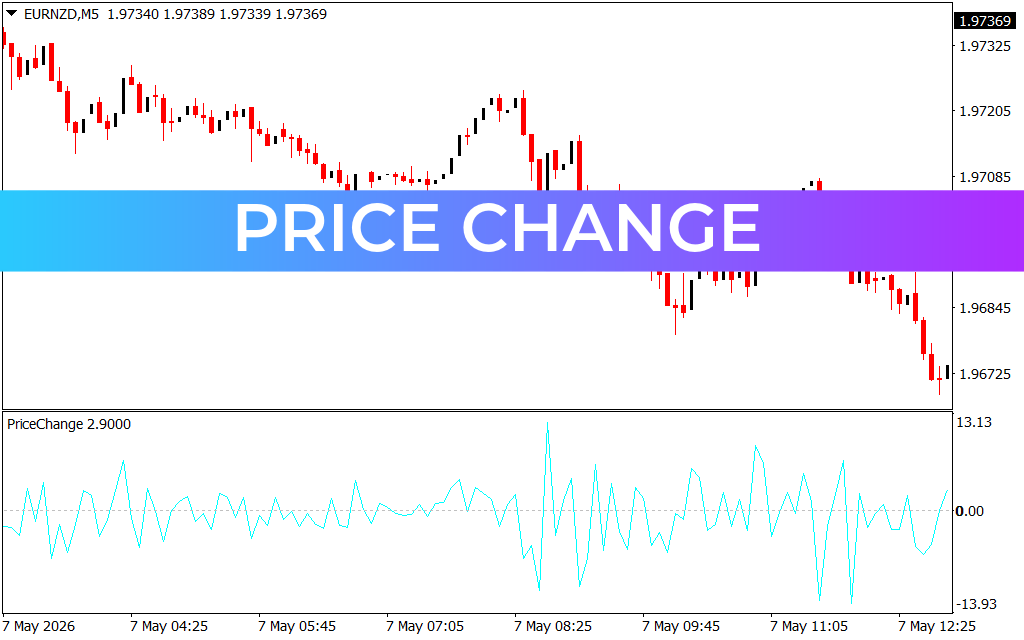
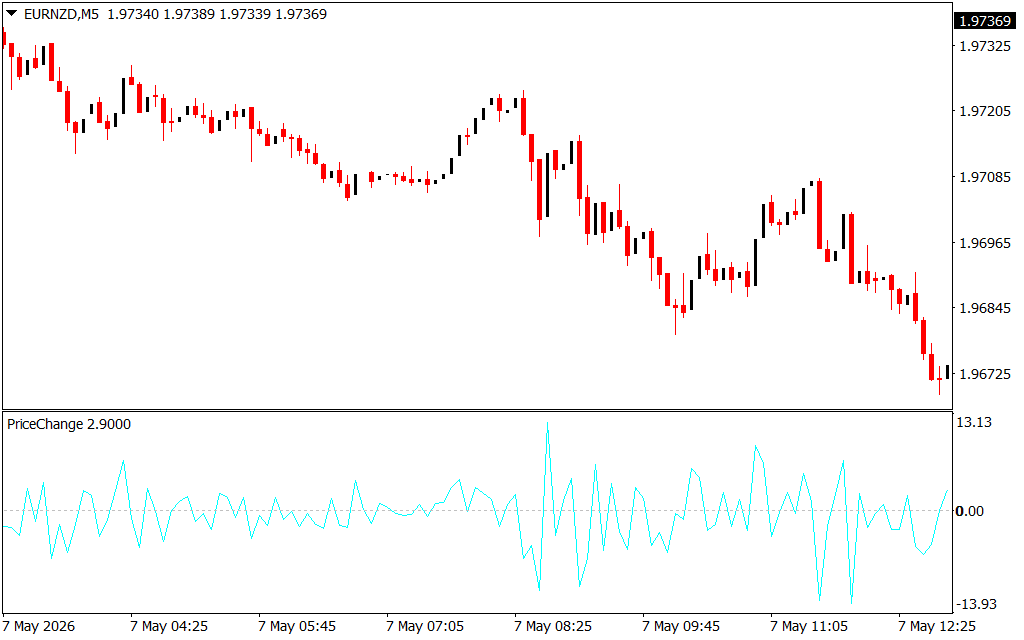
The Price Change Indicator is a momentum-based oscillator that calculates the difference between the current closing price and the closing price of a fixed number of candles ago. It is typically displayed in a separate window below the main price chart as a fluctuating line that moves above and below a central zero-point.
As seen in the EURNZD M5 chart, the indicator captures the "rate of change" in the market. When the light blue line spikes aggressively, it signals high-velocity movement—essential information for traders looking to enter during momentum bursts or exit before a trend exhausts itself.
Why Every Trader Needs a Price Change Tool
Understanding the velocity of price is a key component of risk management and strategy execution. Here is how the Price Change Indicator enhances your trading edge:
- Momentum Identification: By looking at the slope and height of the indicator's peaks, you can instantly see if a trend is accelerating or slowing down. A rising price accompanied by a falling Price Change line often signals a "divergence," warning of a potential reversal.
- Volatility Analysis: The indicator highlights periods of market expansion and contraction. During low-volatility periods, the line remains close to the 0.00 level. When the line expands toward its extremes, it alerts you to high-activity environments where price spreads may widen and movements become more impulsive.
- Objective Data: It removes the emotional guesswork from trading. Instead of wondering if the market is moving "fast," you have a concrete numerical value—such as the 2.9000 reading shown in the example—to base your decisions on.
- Versatility: Whether you are a scalper on the 1-minute chart or a swing trader on the daily timeframe, the Price Change Indicator adapts to any asset class, including Forex, Stocks, and Commodities.
Strategic Implementation
One of the most effective ways to use this tool is for Breakout Confirmation. If the price breaks a major support or resistance level, a simultaneous spike in the Price Change Indicator confirms that there is sufficient "force" behind the move to sustain it.
Additionally, it serves as an excellent filter for mean-reversion strategies. When the indicator reaches historical extremes (the highest or lowest peaks in the window), it suggests that the price has moved "too far, too fast" and is likely due for a corrective pullback toward the average.
Conclusion
The Price Change Indicator is a foundational utility that brings transparency to market dynamics. By focusing on the mechanics of price movement, it allows you to trade with a deeper understanding of momentum and volatility. Incorporate this tool into your MT4 or MT5 setup today to refine your entries and master the rhythm of the markets.
1 Download
Last Update:
May 08, 2026 01:09 AM
Published:
Jan 26, 2026 15:01 PM
Category: