Streamlining Account Metrics: The Profit Info Indicator MT4
Managing open positions across multiple currency pairs can quickly become overwhelming for intraday day traders. When scaling into multiple positions or running complex basket strategies, monitoring total exposure requires constant mental math or flipping back and forth between the MetaTrader terminal's default toolbox window. In fast-moving market regimes, a delay in reading your net financial standing can lead to missed exit targets or unmitigated risk exposure. The Profit Info Indicator MT4 solves this exact issue by bringing essential account metrics directly into your primary workspace.
Here is an analytical breakdown of how this structural diagnostic utility operates and how to use its data matrix to clean up your execution workflow.
The Operational Architecture of Account Data Tracking
The core purpose of the Profit Info system is to give traders absolute clarity regarding their real-time financial exposure. Standard trading setups often leave a gap between technical analysis screens and active account parameters. By deploying an automated calculation sub-window directly beneath your asset candlesticks, this indicator syncs up your technical workspace with your broker's account database.
The underlying algorithm continuously tracks buy and sell parameters, processing position totals, point distributions, and net financial outcomes simultaneously. This matrix removes the cognitive friction of tracking multiple open tickets. It provides a clean, unified command bridge that updates with every single incoming price tick.
Deciphering the Profit Info Data Sub-Window
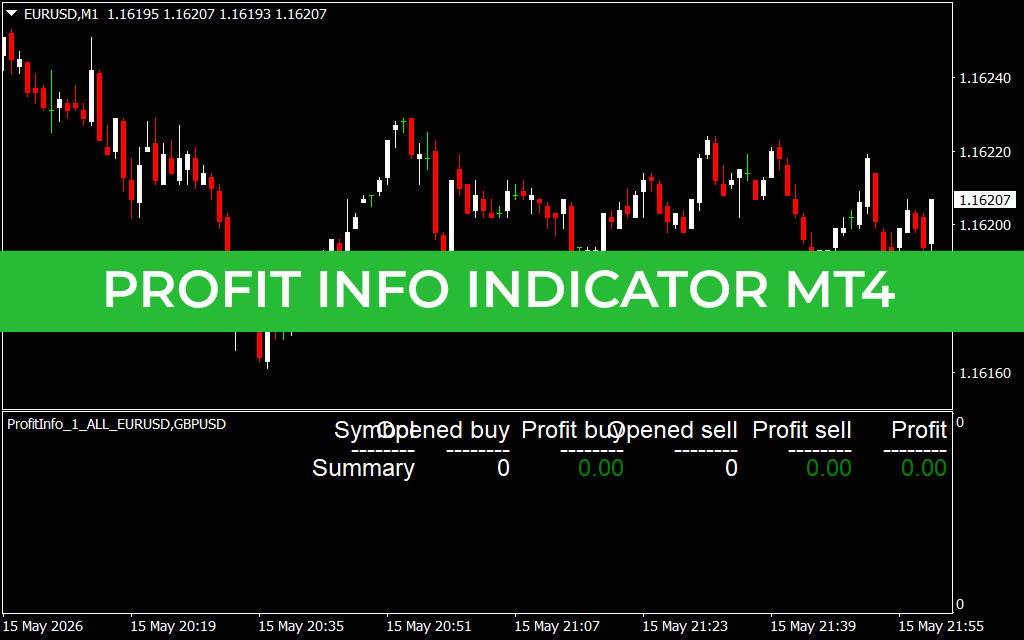
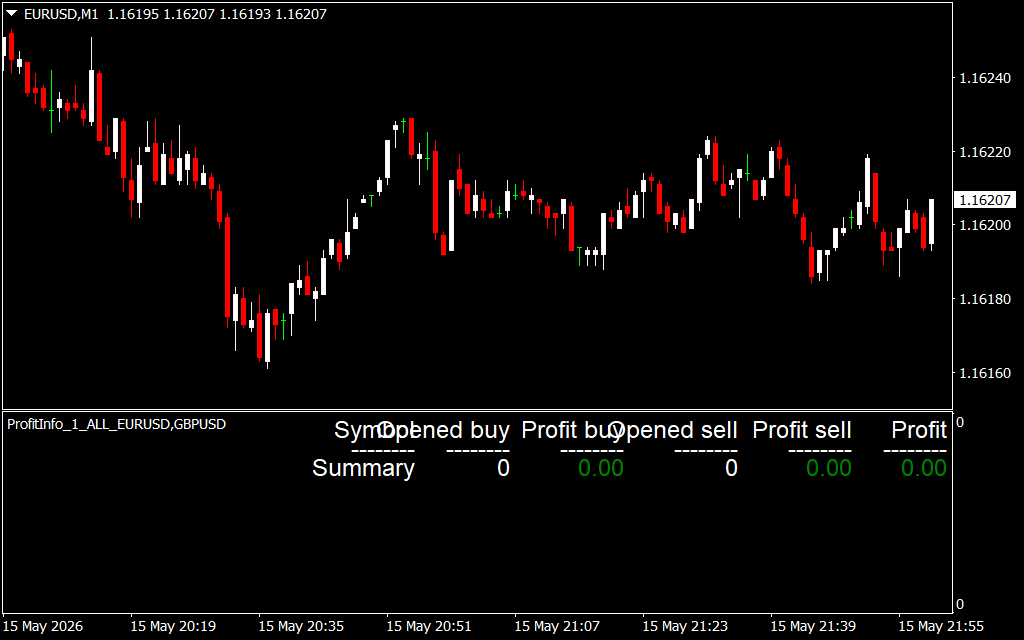
As displayed on the EUR/USD 1-minute chart workspace, the indicator displays a clean, structured reporting matrix in an independent window below the main candle track:
- The Asset Tracker Roster (Symbol Column): This sector lists the exact currency pairs or financial instruments currently active in your open portfolio. This structure helps you monitor isolated asset performance from a single centralized window.
- The Directional Volume Fields (Opened Buy / Opened Sell): These blocks display the precise number of active contracts running in each direction. If your strategy relies on complex hedging models or multiple entries, this column keeps your exact positional balance highly visible.
- The Isolated Tracking Tracks (Profit Buy / Profit Sell): Rather than blending data into an ambiguous sum, the panel splits up your financial metrics. It highlights exactly how much equity your long entries are generating versus your short positions, helping you spot underperforming setups immediately.
- The Net Strategic Outcome (Summary Line): Located at the base of the interface, the Summary row acts as your final filter. It calculates total exposure and displays your net profit or loss in a bold, color-coded readout, making it easy to spot your exact breakeven points.
Strategic Guidelines for Real-Time Risk Management
To extract the highest technical value from the Profit Info panel on your execution screens, apply these structural trading guidelines:
- Managing Basket Strategies: When running automated grids or manual correlation trades across paired instruments, rely on the Summary line as your primary target trigger. This allows you to close out an entire basket of trades based on total net profitability rather than tracking individual lines.
- Optimizing Hedging Formulations: If you actively hold opposing positions on an asset to get through highly volatile news events, use the split tracking tracks to look for local reversals. When one side hits a structural target, you can close out that specific track while letting the remaining side ride out the trend.
- Clean Terminal Architecture: Position the indicator panel at the very base of your multi-monitor setups. This setup lets you hide the bulky default terminal window entirely, saving critical screen space for your core Price Action structures and entry indicators.
1 Download
Last Update:
May 17, 2026 02:37 AM
Published:
Jan 20, 2026 22:26 PM
Category: