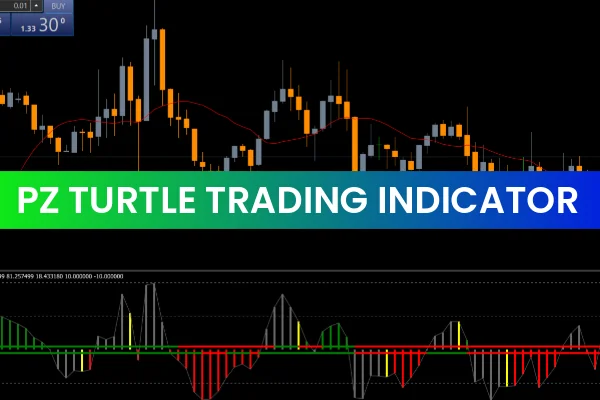
The PZ Turtle Trading Indicator for MT5 is designed based on the legendary Turtle Trading system created by Richard Dennis and William Eckhardt. The original strategy focused on trading breakouts and capturing strong market trends. With the PZ Turtle Trading Indicator, these rules have been transformed into a simple and highly visual MT5 indicator that detects breakout zones, trend directions, and potential BUY/SELL signals.
This breakout-based indicator helps traders identify when the market is ready to move in a clear direction rather than remaining in consolidation. Breakouts are a popular method for identifying trend continuation and momentum-based entries, making this tool valuable for Forex traders, crypto traders, and synthetic index traders.
How the PZ Turtle Trading Indicator Works
The indicator analyzes past price movements and draws breakout levels based on recent highs and lows. These levels indicate where the market may break structure and form a trend continuation.
Blue breakout level: Signals bullish breakout zone
Red breakout level: Signals bearish breakout zone
When price crosses one of these levels, the indicator confirms a possible trade with an arrow. This simplifies the decision-making process and reduces time spent analyzing charts.
Trading Signals and Rules
The PZ Turtle Trading Indicator generates clear signals that many traders consider easy to follow.
BUY Setup
A long trade may be placed when:
A blue breakout level appears
A blue arrow confirms bullish direction
Price breaks above the breakout level
This indicates strength and momentum in favor of buyers.
SELL Setup
A short trade may be placed when:
A red breakout level appears
A red arrow confirms bearish momentum
Price breaks below the level
These signals represent weakness and continuation to the downside.
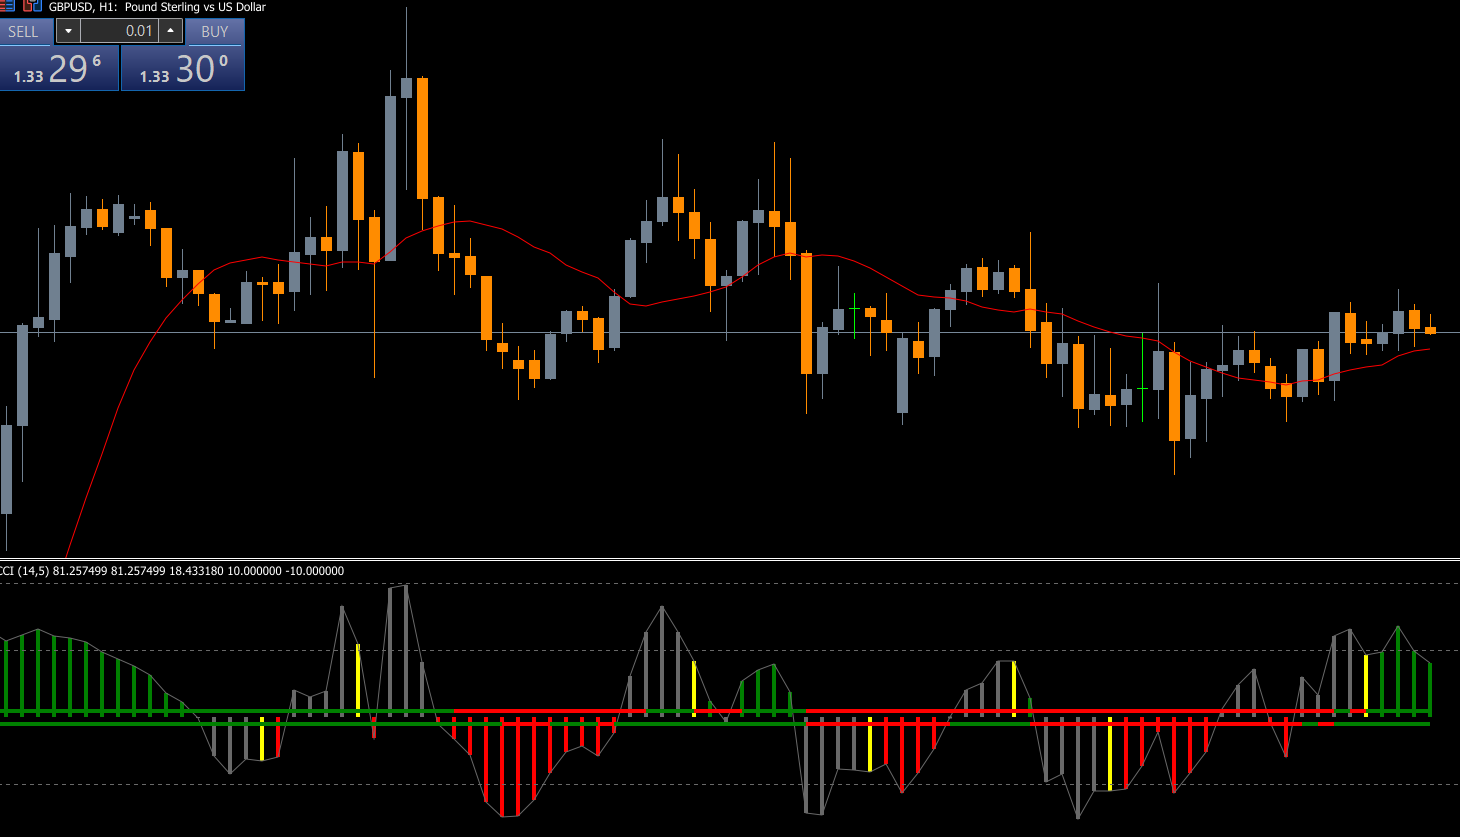
Best Timeframes to Use
While the indicator works on all timeframes, it performs best on higher timeframes, such as:
H1
H4
D1
Higher timeframes help filter false breakouts and provide stronger confirmation for long-term trend opportunities.
Benefits of Using PZ Turtle Trading Indicator
Easy-to-Use Visual System
Breakout lines and arrows make signal recognition fast and beginner-friendly. Based on Proven Strategy
The Turtle Trading system has a long history of verifying effectiveness in trend-following markets.
Works on Many Assets
Useful for Forex pairs like GBP/USD, EUR/USD, as well as commodities, indices, and cryptocurrencies.
Enhances Risk Management
Since breakout levels act as support/resistance, traders can set stop-loss levels more accurately.
Tips for Better Results
To strengthen accuracy, traders can combine the indicator with:
Moving Averages
ATR (Average True Range) for volatility
Support And Resistance analysis
Using confirmations reduces false signals and improves win probability.
Conclusion
The PZ Turtle Trading Indicator for MT5 is a helpful tool for identifying breakout levels and trend direction using a time-tested trading method. With clear alerts, breakout visualization, and automatic arrow signals, traders can confidently open long or short positions based on market movement.
👉 Download the PZ Turtle Trading Indicator for free at IndicatorForest.com and start improving your breakout trading approach today.
FAQ
10 Downloads
Published:
Dec 09, 2025 02:09 AM
Category: