Smooth Trend Identification: The QEMA Direction V1 Indicator Explained
Moving averages are fundamental tools in a technical trader's arsenal, used primarily to smooth out short-term price fluctuations and uncover underlying market trends. However, standard calculations like the Simple Moving Average ($SMA$) or Exponential Moving Average ($EMA$) often force traders into a difficult compromise: accept significant lag to get a smooth line, or decrease the period to react quickly at the expense of encountering market noise and false signals. The QEMA Direction V1 Indicator eliminates this trade-off by utilizing Quadruple Exponential Moving Average mathematics to deliver ultra-low lag trend tracking.
Here is a breakdown of how this advanced filtering tool works and how to leverage it for precise chart execution.
The Mathematics Behind QEMA
The acronym QEMA stands for Quadruple Exponential Moving Average. While a traditional $EMA$ applies a single layer of exponential smoothing to raw price data, a standard Hull or Triple $EMA$ ($TEMA$) runs multiple algorithmic loops to reduce data lag. QEMA takes this a step further by calculating a four-layered composite average.
This intensive mathematical compounding strips away the lag inherent in standard historical data calculation loops. The resulting moving average curve clings tightly to live Price Action during vertical expansions while maintaining a smooth, structural curve during standard market pullbacks.
Analyzing the Signal Line on the Chart
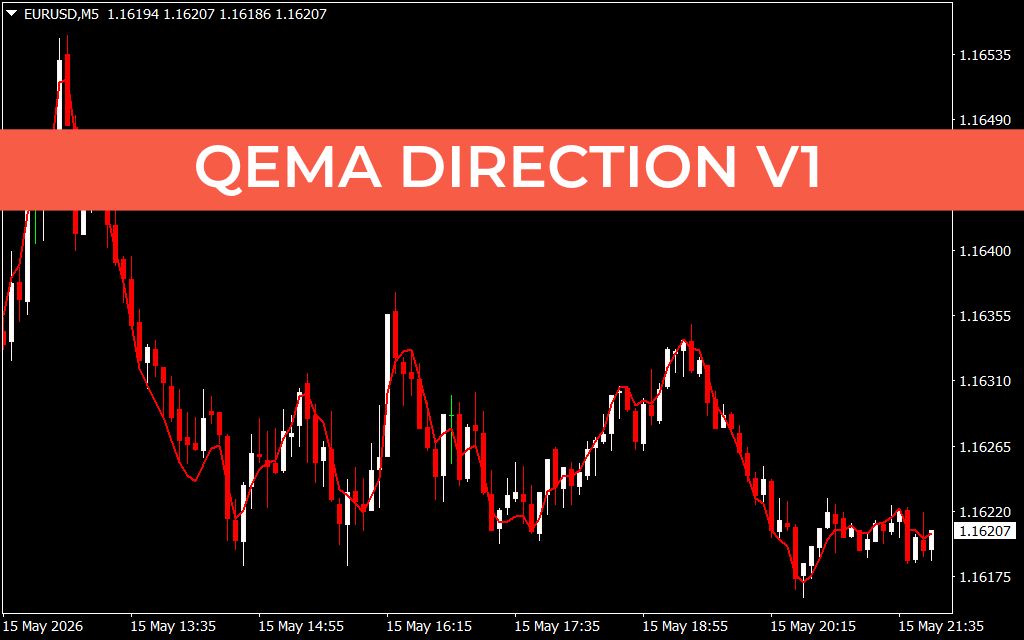
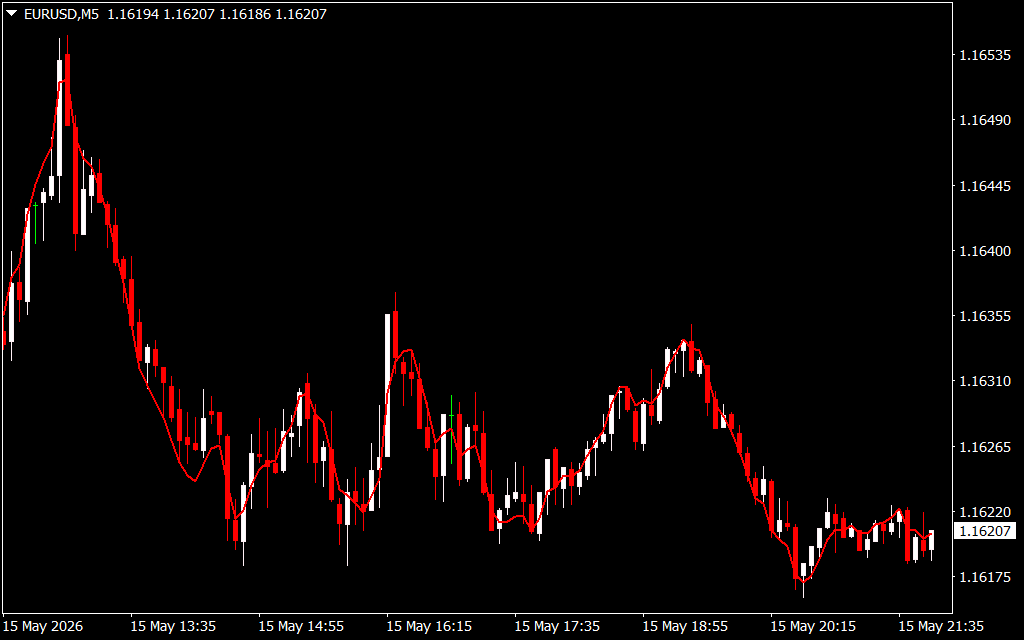
As demonstrated on the EUR/USD M5 charts, the QEMA Direction V1 system keeps your primary terminal exceptionally clean. Instead of filling your screen with multiple intersecting lines or cluttered sub-windows, it plots a single, adaptive line directly over the candlestick price action:
- The Bullish Regime: When the market enters a sustained buying phase, the QEMA line shifts beneath the price candles. It acts as an immediate, dynamic support floor that climbs continuously alongside the ascending structural swing lows.
- The Bearish Regime: Conversely, during market liquidations, the QEMA line tracks cleanly above the descending candlestick peaks. In this environment, the line serves as a definitive overhead resistance ceiling.
- The Trailing Dots Overlay: When paired with a volatility tracking mechanism (as seen in the companion M5 chart layout), the system anchors key trailing dots at major structural inflection points. A blue dot below price confirms institutional defense of a support zone, while a pink dot above highlights verified distribution.
Because the QEMA calculation responds rapidly to price velocity, a sharp angle in the line indicates strong trend momentum, whereas a flattening line instantly alerts you that the market is entering a low-volume consolidation zone.
Strategic Integration for Intraday Trading
To maximize the mathematical edge of the QEMA Direction V1 indicator, implement these structured trading guidelines:
- Precision Crossover Entries: Rather than guessing a market bottom or top, wait for a 5-minute or 15-minute candle to cross completely over the QEMA line and close on the opposite side to confirm a true momentum shift.
- Dynamic Trailing Stop-Loss: Use the path of the QEMA line as an objective trailing stop. If you are in a short position, manually trail your stop-loss order a few pips above the descending line to lock in intraday profits automatically.
- Trend Filter for Oscillators: Use the QEMA direction on a higher timeframe (like the H1) as your primary trend filter. If the QEMA line is sloping downward on the hourly chart, only take short signals from your lower-timeframe oscillators to stay aligned with major institutional order flow.
33 Downloads
Last Update:
May 17, 2026 01:50 AM
Published:
Jan 20, 2026 23:03 PM
Category: