Advanced Trend Filtering with the QQE Histogram Indicator
In modern technical analysis, finding a balanced balance between responsiveness and reliability is a core challenge. Most standard oscillators, such as the classic Relative Strength Index (RSI), are highly prone to generating premature signals or whipsawing traders during fast-moving consolidation phases. The QQE Histogram Indicator (Qualitative Quantitative Estimation) addresses this limitation directly. By upgrading a classic quantitative smoothing model into an intuitive, color-coded sub-window histogram, this tool helps retail traders filter out retail noise and track institutional trend velocity with absolute clarity.
The Evolution of Qualitative Quantitative Estimation
The original QQE framework is built around an advanced modification of a smoothed 14-period RSI. Rather than relying on simple moving averages which introduce severe lag, the QQE algorithm processes price velocity using a dual-layered smoothing technique and tracks an integrated trailing stop line derived from an Average True Range (ATR) mathematical variance.
The QQE Histogram edition takes these multi-layered quantitative lines off your main workspace and translates them into a highly visual, real-time momentum chart panel:
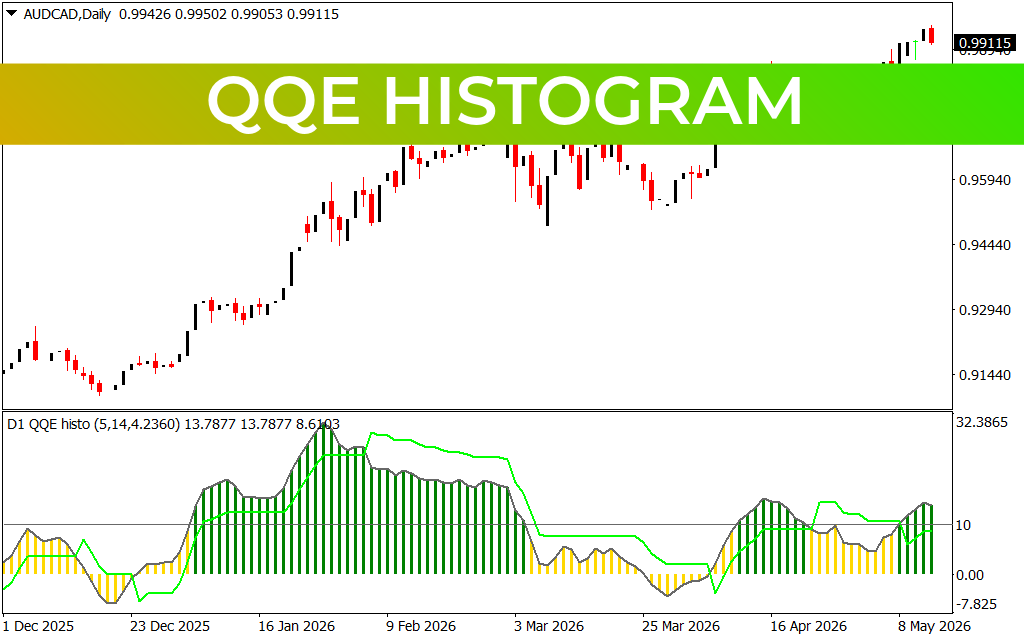
- Green Histogram Bars: Signal expanding bullish momentum. When the bars scale above the zero-bound axis line, it reveals that short-term buying pressure is accelerating past the historical baseline, validating long entries.
- Yellow Histogram Bars: Indicate a transitional or contraction phase. When the bars turn yellow, it flags a momentum slowdown. This warns you that a current move is losing structural volume, signaling a potential consolidation block or an impending Trend Reversal.
- The Dynamic Trailing Signal Line: Running concurrently across the histogram is an adaptive trend-line (often displayed as a fluctuating green/grey wave). The interaction between the histogram bars and this trailing threshold highlights key momentum breakouts and structural distribution fields.
Implementing QQE Histogram into Your Execution Checklist
Integrating this indicator into your daily software layout provides structured, rule-based parameters for entry execution and portfolio risk management:
- Mechanical Trend Confirmation: Instead of chasing breakouts blindly, look for the histogram to transition cleanly from yellow to green above the zero axis. This visual shift confirms that the breakout possesses genuine structural momentum rather than being a retail market trap.
- Spotting Hidden Divergences: If Price Action prints a structural higher high on the main chart, but the QQE Histogram prints a noticeably lower peak, a major bearish divergence is unfolding. This structural decay warns that buying pressure is exhausted, acting as a strict signal to tighten stop-losses or extract profits.
- Volatility-Assisted Trailing: The structural peaks and troughs of the histogram bars, paired with its dynamic trailing baseline, offer an exceptional blueprint for trailing your risk. Traders can comfortably let profitable positions run until the histogram bars flip color or cross back inside the signaling wave.
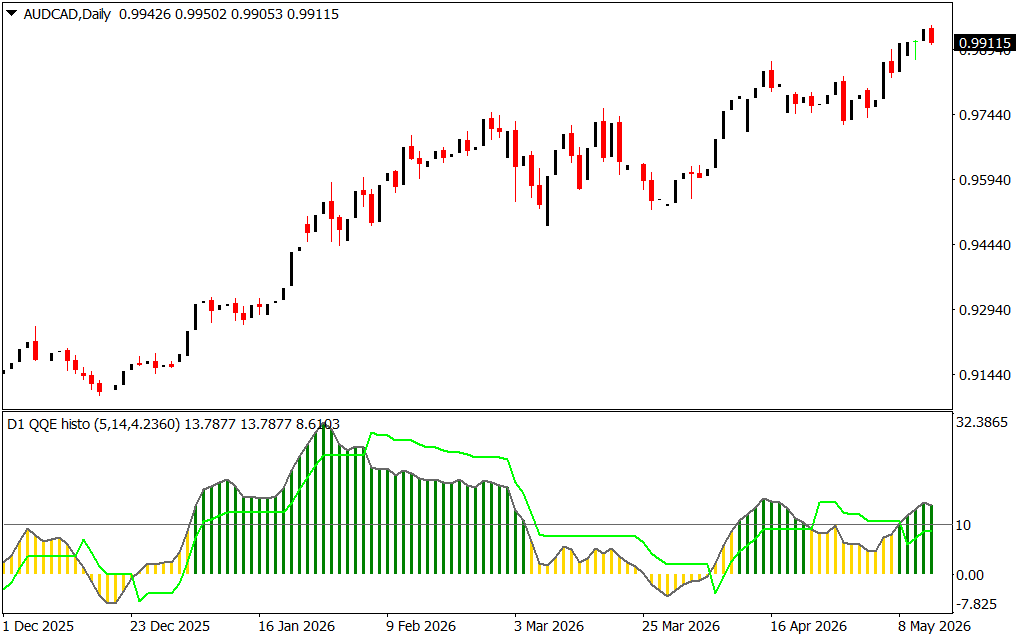
Macro Precision on the Daily Chart
While scalable to shorter intraday timeframes for fast-paced Scalping, the QQE Histogram Indicator delivers masterclass clarity on macro timeframes like the Daily chart. As shown on the AUD/CAD Daily layout, the indicator neatly captures multi-month structural trend expansions while successfully ignoring minor daily pullbacks. By anchoring your portfolio baseline to macro daily QQE trends, you significantly improve your overall statistical edge.
1 Download
Last Update:
May 14, 2026 21:25 PM
Published:
Jan 22, 2026 00:55 AM
Category: