Mastering Multi-Timeframe Momentum with the Rads Stoch Bar Indicator
In the high-velocity world of Forex trading, technical indicators that can distill complex market data into simple, actionable signals are invaluable. The Rads Stoch Bar Indicator is a premier technical tool designed for the MetaTrader platform that revolutionizes how traders interpret momentum. By taking the proven logic of the Stochastic Oscillator and projecting it across multiple timeframes in a clean bar format, this indicator provides a "bird's-eye view" of the market that traditional oscillators simply cannot match.
The Power of Multi-Timeframe Alignment
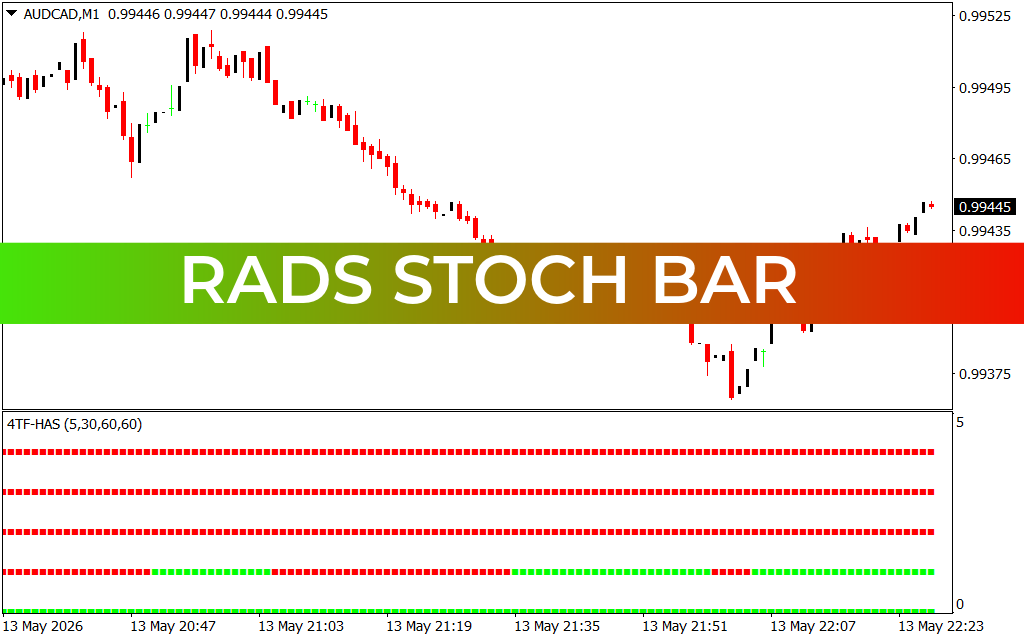
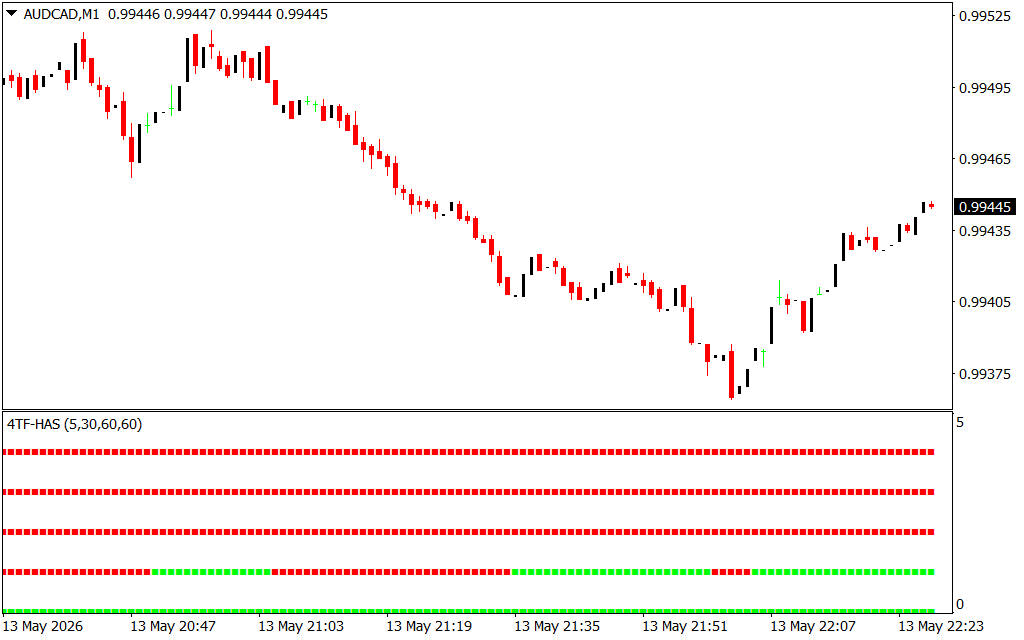
One of the greatest challenges for any trader—especially those operating on lower timeframes like the M1 or M5—is falling into "bull traps" or "bear traps" because they are trading against the larger trend. The Rads Stoch Bar (often labeled as a 4TF or multi-timeframe HAS system) solves this by displaying the momentum status of four different timeframes simultaneously in the sub-window of your chart.
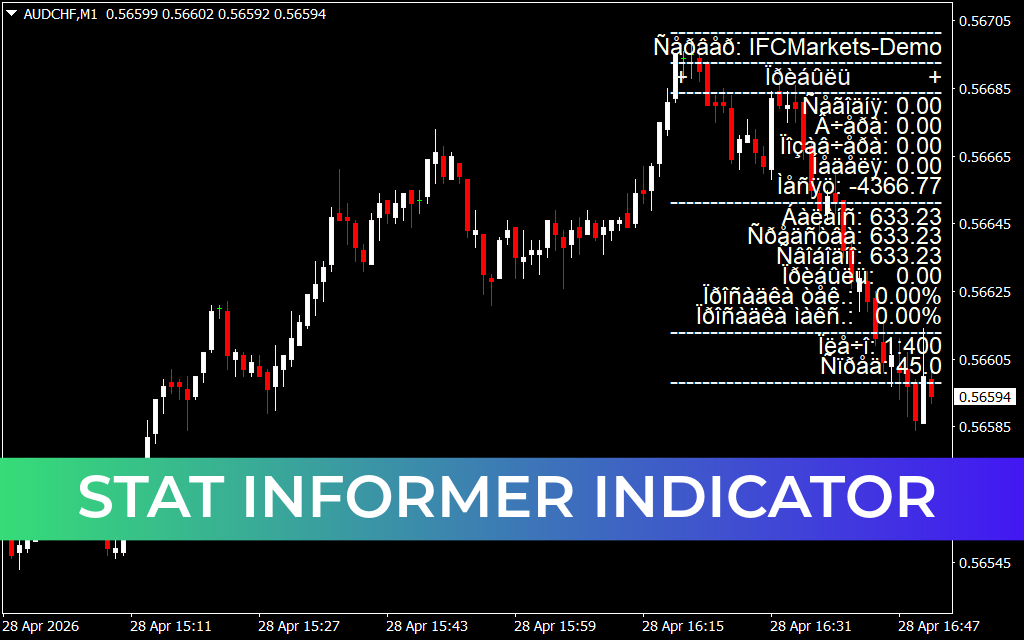
As shown in the AUD/CAD M1 example, the indicator uses a series of color-coded dots or bars. Green signifies bullish momentum, while Red indicates bearish momentum. When multiple rows align in the same color, it signals a high-probability "confluence" zone where the short-term Price Action is synchronized with the long-term trend.
Key Features and Strategic Advantages
- Visual Confluence at a Glance: Instead of switching between four different charts, the Rads Stoch Bar allows you to see the state of the M5, M15, M30, and H1 (or any preferred settings) directly on your current screen.
- Reduced Market Noise: Stochastic oscillators can often "whipsaw" in choppy markets. By viewing the momentum as a solid bar, traders can ignore minor fluctuations and only enter trades when the "weight of evidence" from multiple timeframes supports the move.
- Precision Entry and Exit: The indicator is particularly effective for identifying exhaustion. When the lower rows begin to flip from red to green while the upper rows are already green, it marks a perfect "buy on dip" opportunity. Conversely, when all bars turn red, it signals that the bearish momentum is unanimous across the board.
- Clean Chart Interface: By moving the technical analysis to a dedicated sub-window, your main price chart remains clean and focused on price action, candlesticks, and structural levels.
Application for Scalpers and Day Traders
For a scalper, the Rads Stoch Bar acts as a final filter. Before taking a "Buy" signal on the 1-minute chart, a professional trader looks down at the indicator to ensure that at least the two or three rows above it are also green. This simple step significantly increases the win rate by ensuring you are never swimming against the tide of the broader market.
On the provided AUD/CAD chart, notice how the price recovery toward the end of the session coincides with the bottom rows of the Rads Stoch Bar flipping back to green. This visual confirmation provides the confidence needed to execute trades with precision.
Conclusion
The Rads Stoch Bar Indicator is a must-have for traders who value confluence and clarity. By transforming the classic Stochastic Oscillator into a multi-timeframe momentum map, it empowers you to trade with the trend, reduce false signals, and master the art of market timing.
3 Downloads
Last Update:
May 14, 2026 01:29 AM
Published:
Jan 23, 2026 00:20 AM
Category: