Decoding Market Noise: The Random Walk Index Experiment Indicator
In technical analysis, one of the most persistent challenges is determining whether an asset is moving in a genuine, statistically significant trend or simply drifting through random price noise. Many traditional indicators fail to make this distinction, generating false buy or sell signals during periods of aimless market churn. The Random Walk Index (RWI) Experiment Indicator solves this structural dilemma by using mathematical probability to measure whether price changes are part of a true directional trend or merely a random walk.
Here is an analysis of how this unique technical tool functions and how to use it to optimize your market execution.
The Mathematics of the Random Walk Index
Developed by Michael Poulos, the Random Walk Index operates on the premise that the shortest distance between two points is a straight line. If a market is trending efficiently, its path will resemble a straight line, pulling away from a starting point much faster than expected by chance.
The RWI calculation compares an asset’s actual price range over a specific lookback period to a theoretical "random walk"—the expected maximum distance price would travel if it were moving completely by accident (similar to a series of random coin flips).
- RWI High (Bulls): Measures the strength of the upward movement.
- RWI Low (Bears): Measures the strength of the downward movement.
When an RWI value climbs above the $1.00$ threshold, it mathematically proves that the movement is too strong to be random noise, confirming the birth of an authentic trend.
Interpreting the Experimental Chart Levels
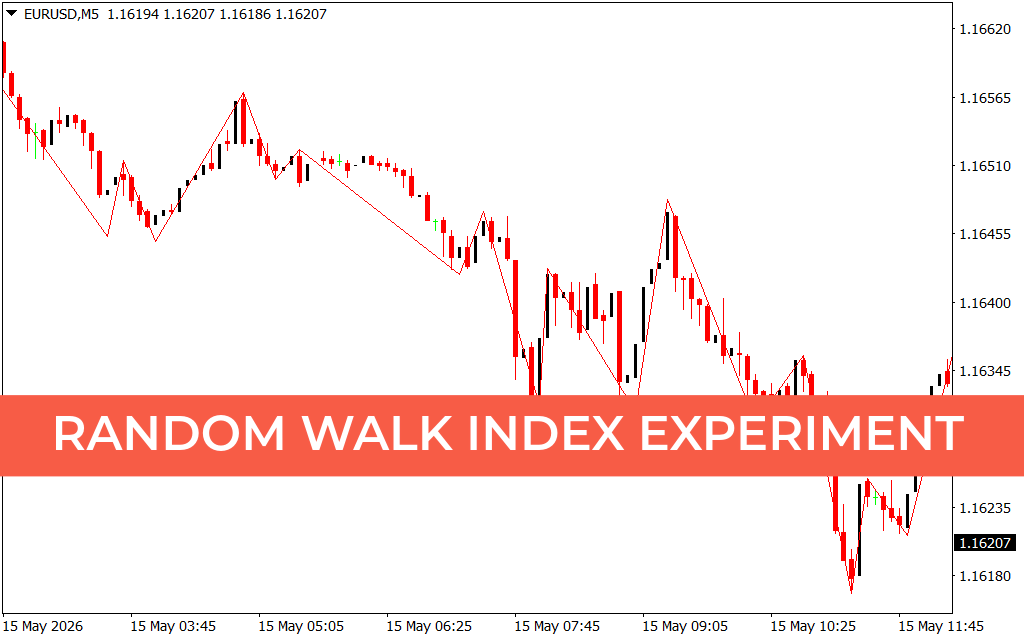
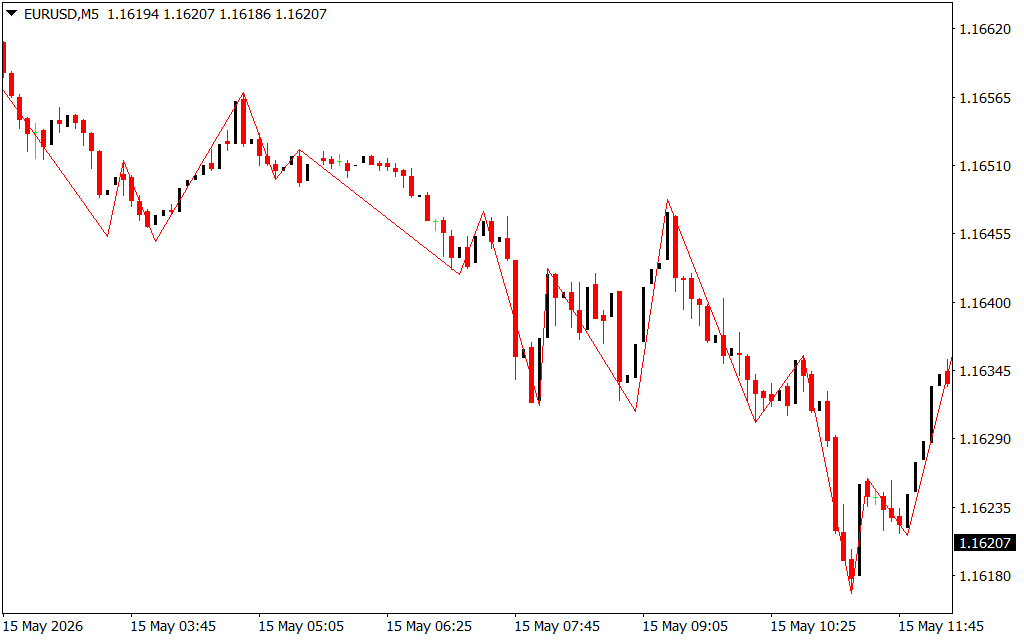
As demonstrated on the EUR/USD M5 chart, this indicator strips away complex screen clutter, delivering clean, actionable trend validation through its intuitive mathematical paths:
- The Noise Ceiling ($1.00$): The horizontal reference line at $1.00$ serves as the ultimate dividing line between chaos and order. Any reading below this line means the market is behaving randomly and should be treated as a consolidation zone.
- The Bullish Velocity Line (Green Line): When the green line crosses above the $1.00$ threshold, it confirms that a statistically significant uptrend is expanding, signaling an ideal environment for long entries.
- The Bearish Velocity Line (Red Line): Conversely, when the red line crosses above $1.00$, it proves that downward liquidation pressure is driving the asset efficiently, validating short positions.
When both lines sit trapped beneath the $1.00$ level, it acts as an early warning system that the asset is stuck in a choppy, low-volume range, prompting day traders to protect capital and stand aside.
Strategic Guidelines for Intraday Trading
To maximize your performance using the Random Walk Index Experiment indicator, implement these structured execution guidelines:
- Precision Breakout Execution: Instead of trying to guess a market bottom or top, wait for either the red or green line to cross decisively above the $1.00$ baseline on the 5-minute chart. This confirmation ensures you are entering precisely as institutional momentum takes over.
- Filtering Indicator Clutter: Use the RWI as a master filter for your other trading systems. For instance, if your favorite oscillator flashes a buy signal, only execute the trade if the RWI High line is above $1.00$, confirming the market isn't just making a random, short-lived wiggle.
- Objective Exit Management: When riding a strong trend, you can trail your position safely until the active RWI line peaks and crosses back below the $1.00$ mark, indicating that the trend has exhausted its efficiency and returned to a random state.
5 Downloads
Last Update:
May 17, 2026 02:16 AM
Published:
Jan 20, 2026 22:37 PM
Category: