Master Volatility with the Range Bound MA Indicator
Trading in sideways or "choppy" markets is one of the most significant challenges for technical analysts. Most trend-following tools fail during these periods, leading to frequent "whipsaws" and capital erosion. The Range Bound MA is a specialized trend-confirmation utility designed specifically to identify when a market is transitioning from a tight range into a sustained directional move, allowing traders to stay sidelined during low-probability phases and strike when the "range" is finally broken.
The Logic of Adaptive Range Filtering
Traditional moving averages are constantly "in the market," regardless of whether a trend exists. The Range Bound MA (Moving Average) utilizes a proprietary volatility filter that measures the distance between price and its average value over a set period. By calculating this variance, the indicator determines if the market is currently "range-bound" or "trending."
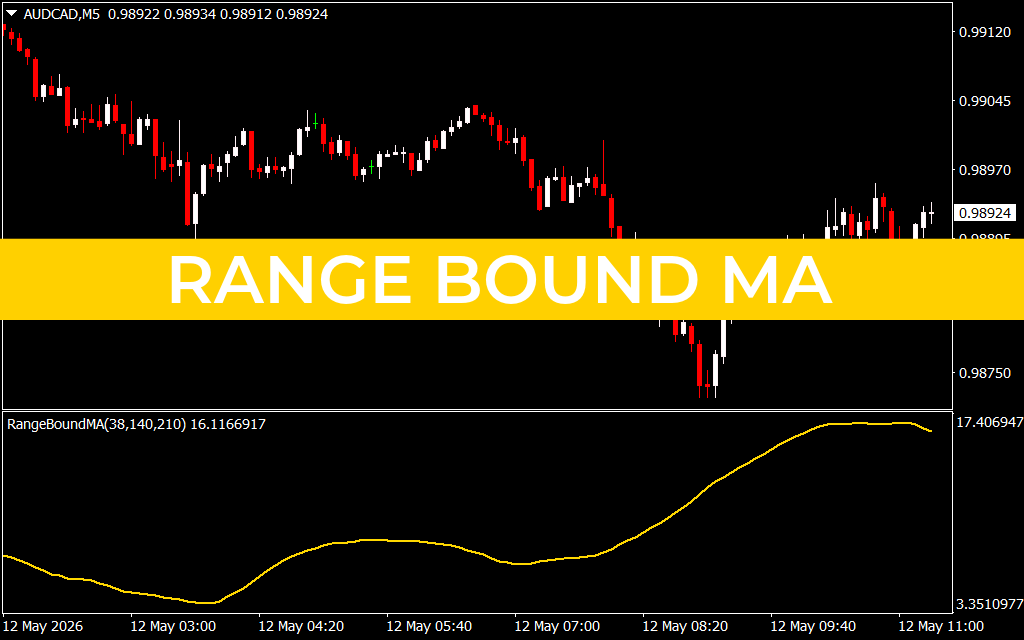
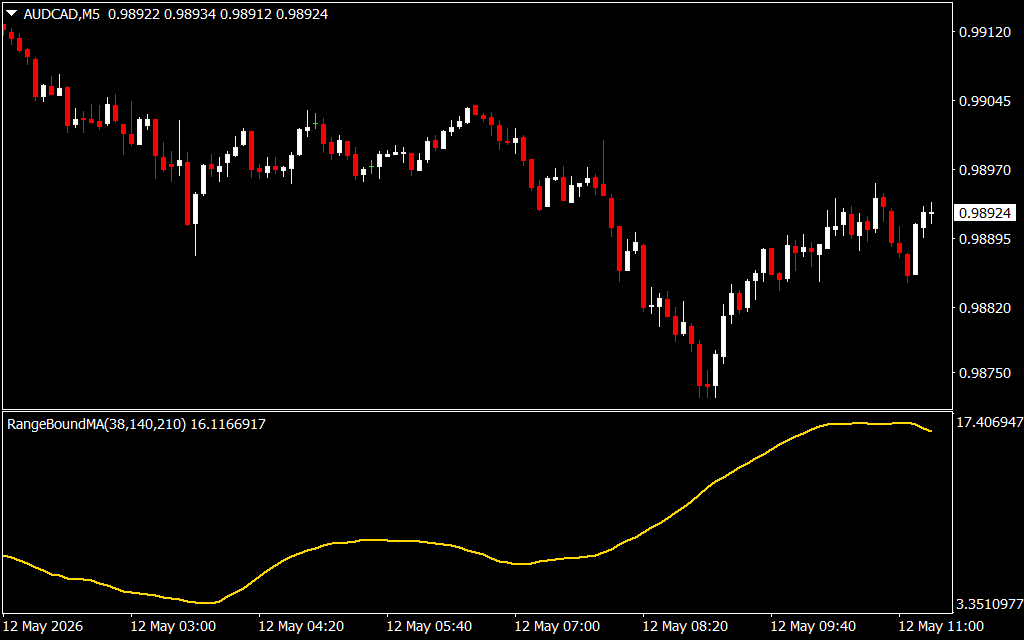
As demonstrated in the AUD/CAD M5 chart, the indicator appears in a dedicated sub-window as a smooth, continuous yellow line. Unlike standard oscillators that bounce between fixed levels, the Range Bound MA moves in direct proportion to the expansion or contraction of the market's trading range. A rising yellow line indicates that volatility is expanding and a trend is gaining strength, while a flat or descending line warns that the market is entering a period of consolidation.
Key Benefits for Intraday Strategy
For traders operating on the 5-minute (M5) or 15-minute (M15) timeframes, the Range Bound MA provides critical structural context:
- Confirmation of Trend Persistence: The indicator excels at identifying "healthy" trends. In the provided AUD/CAD example, the steady climb of the yellow line confirms that the bullish recovery is backed by consistent momentum, rather than a random price spike.
- Avoidance of "Choppy" Zones: By monitoring the slope of the indicator, traders can avoid entering positions when the market is lacklustre. A flat Range Bound MA is a clear signal to wait for a volatility breakout.
- Dynamic Overextension Alerts: When the indicator reaches extreme highs (as seen toward the end of the chart), it suggests that the current move is potentially overextended. This allows traders to tighten their stop-loss orders or take partial profits before a mean-reversion move occurs.
- Platform Efficiency: The Range Bound MA is optimized for the MetaTrader environment, providing professional-grade volatility analysis without lagging the price chart or cluttering the workspace.
Strategic Implementation
The Range Bound MA is most powerful when used as a "volatility filter" for other technical indicators. For instance, if your primary system generates a buy signal, you would check the Range Bound MA: if the yellow line is beginning to slope upward, it confirms that the market has the "fuel" necessary to sustain the move.
By integrating this tool into your daily routine, you move from simply following price to understanding the volatility structure of the market. It is an essential asset for any trader looking to professionalize their approach and master the art of trading breakouts and ranges with confidence.
1 Download
Last Update:
May 12, 2026 14:25 PM
Published:
Jan 23, 2026 17:56 PM
Category: