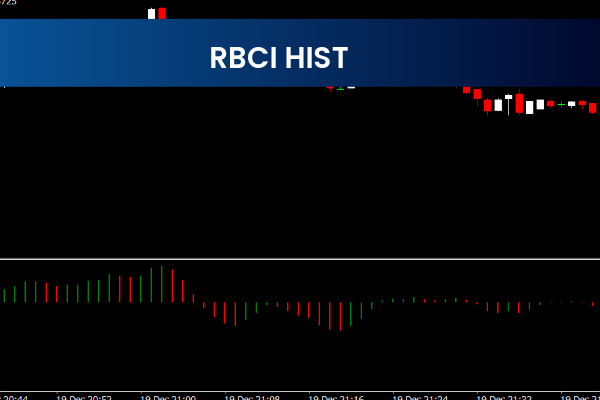
The RBCI Hist Indicator is a popular and free Forex indicator designed for traders using the MetaTrader 4 (MT4) platform. This indicator helps traders identify current market trends by combining both Price Action and trading volume into a single analytical tool. By using the Relative Balance Channel Index (RBCI), traders can gain deeper insight into market behavior and build more effective trading strategies.
Overview of the RBCI Hist Indicator
The RBCI Hist Indicator is based on the concept that price movement alone does not provide the full picture of market dynamics. Volume plays a crucial role in confirming trends and identifying potential reversals. By integrating price and volume data, this indicator delivers a more balanced and reliable view of market conditions.
Because of its visual histogram-style display, the indicator makes trend analysis intuitive and easy to interpret, even for beginner traders.
Core Components of the Indicator
The RBCI Hist Indicator consists of two main components that work together to define market direction.
Balance Channel Explained
The Balance Channel represents the average price of a currency pair over a specified period. This line smooths out price fluctuations and helps traders identify the underlying trend. When the Balance Channel moves upward, it suggests bullish momentum. When it slopes downward, bearish conditions are likely present.
Balance Volume Explained
- The Balance Volume measures the total traded volume over a given period. Volume often precedes price movement, making it a valuable confirmation tool. Increasing volume during a trend strengthens its validity, while declining volume may indicate weakening momentum.
Together, these components form the foundation of the RBCI Hist Indicator.
How the RBCI Hist Indicator Identifies Trends
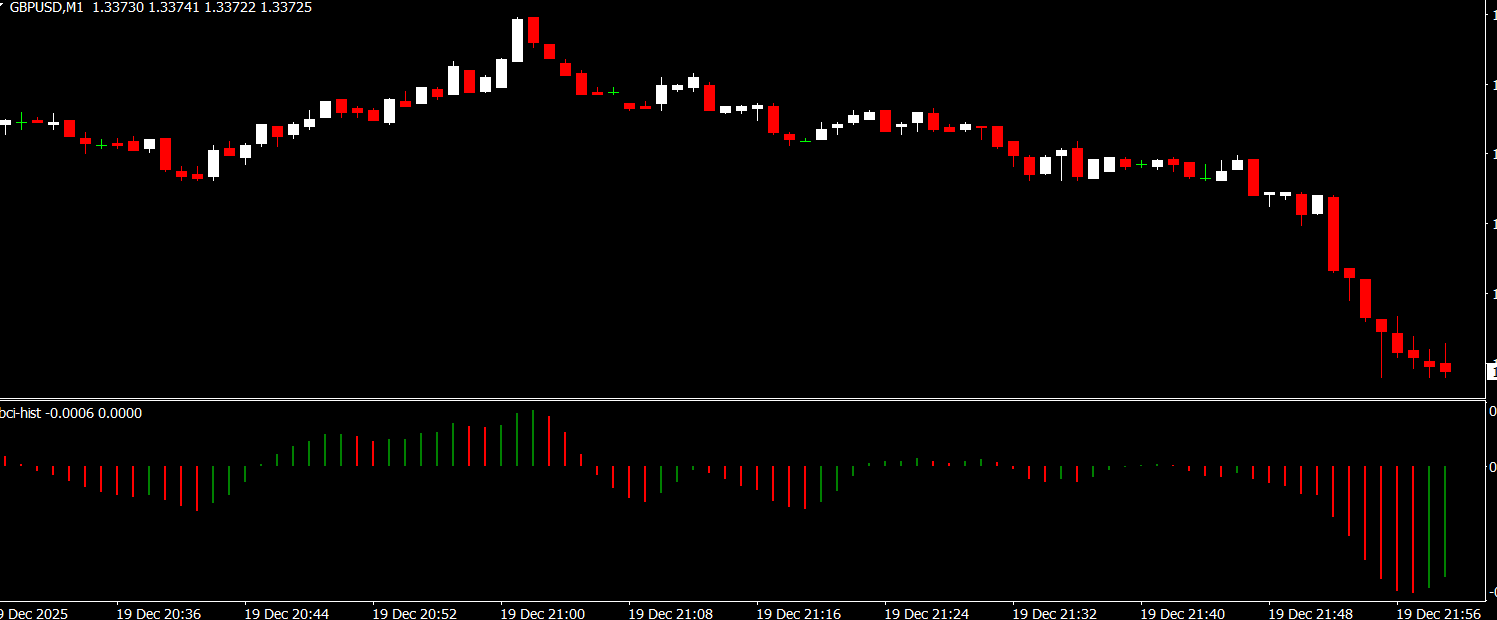
The indicator uses a histogram format to visually represent the relationship between price and volume. When histogram bars are consistently positive, it indicates bullish market conditions supported by volume. When bars turn negative, bearish momentum is likely dominating the market.
This visual approach allows traders to quickly recognize trend shifts without needing complex calculations or multiple indicators.
Trading Signals and Market Interpretation
Traders use the RBCI Hist Indicator primarily for trend confirmation rather than standalone entry signals.
Bullish Market Conditions
When the Balance Channel is rising and the histogram shows increasing positive values, it signals a strong bullish trend supported by volume. Traders may look for buying opportunities in alignment with the trend.
Bearish Market Conditions
When the Balance Channel is falling and the histogram displays negative values, bearish pressure is increasing. This scenario often supports selling opportunities or trade exits.
Using the Indicator in Trading Strategies
The RBCI Hist Indicator works best when combined with other technical tools. Traders commonly pair it with:
Support And Resistance levels
Moving averages
Trendlines
Candlestick patterns
By using the indicator as a confirmation tool, traders can reduce false signals and improve trade accuracy.
Ideal Timeframes and Market Conditions
This indicator performs well across multiple timeframes, making it suitable for Scalping, intraday trading, and swing trading. Higher timeframes tend to produce more reliable trend signals, while lower timeframes are useful for precise entry timing.
The RBCI Hist Indicator is particularly effective in trending markets, where volume confirms sustained price movement.
Ease of Installation and Use on MT4
Installing the RBCI Hist Indicator on MT4 is quick and straightforward. Once added to the platform, it automatically begins analyzing price and volume data in real time. No complex configuration is required, making it accessible to traders of all experience levels.
Why Traders Choose the RBCI Hist Indicator
Traders favor this indicator because it combines two essential market elements into one clear visual tool. It helps filter out noise, confirms Trend Strength, and enhances overall market analysis. Being free and lightweight, it is a valuable addition to any MT4 trading setup.
Final Thoughts
The RBCI Hist Indicator is a powerful Forex trading tool that helps traders identify market trends by combining price and volume analysis. Its clear histogram display and logical structure make it ideal for developing disciplined and informed trading strategies.
To discover more free MT4 indicators, professional trading tools, and Forex resources, visit IndicatorForest.com and take your trading analysis to the next level.
FAQ
Published:
Dec 21, 2025 00:58 AM
Category: