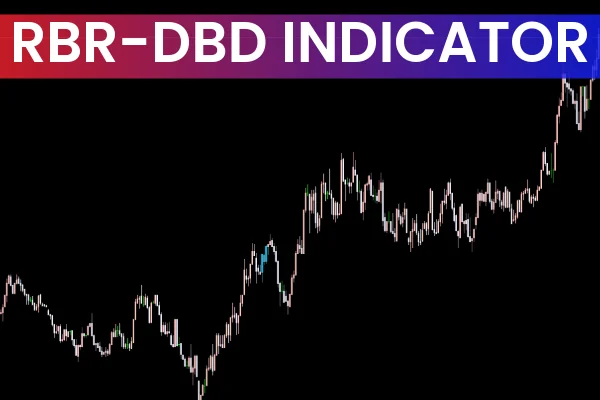
The RBR-DBD Indicator for MetaTrader 5 is a powerful tool designed to detect Rally-Base-Rally (RBR) and Drop-Base-Drop (DBD) patterns directly on the chart. These formations are key elements in Supply And Demand trading and are widely used to identify high-probability reversal points or continuation zones. The indicator scans recent price action and volatility to automatically highlight zones where strong impulsive moves originated from a consolidation base, helping traders anticipate institutional order flow with greater precision.
This indicator is especially useful for traders who follow smart money concepts, refined price action strategies, or anyone who wants a clear visual method to identify true supply and demand levels. By analyzing the strength of impulses and base structures, the RBR-DBD Indicator marks significant candles using clear color-coded highlights, simplifying market interpretation.
Discover More
MT4 • MetaTrader 5 • MetaTrader 4 • MT5 • Algo Trading • Algorithmic Trading • Lucky Reversal Indicator • Sentiment Indicator Bundles • Automated Trading Systems • Sentiment Indicators MT4/MT5
RBR-DBD Indicator Trading Signals
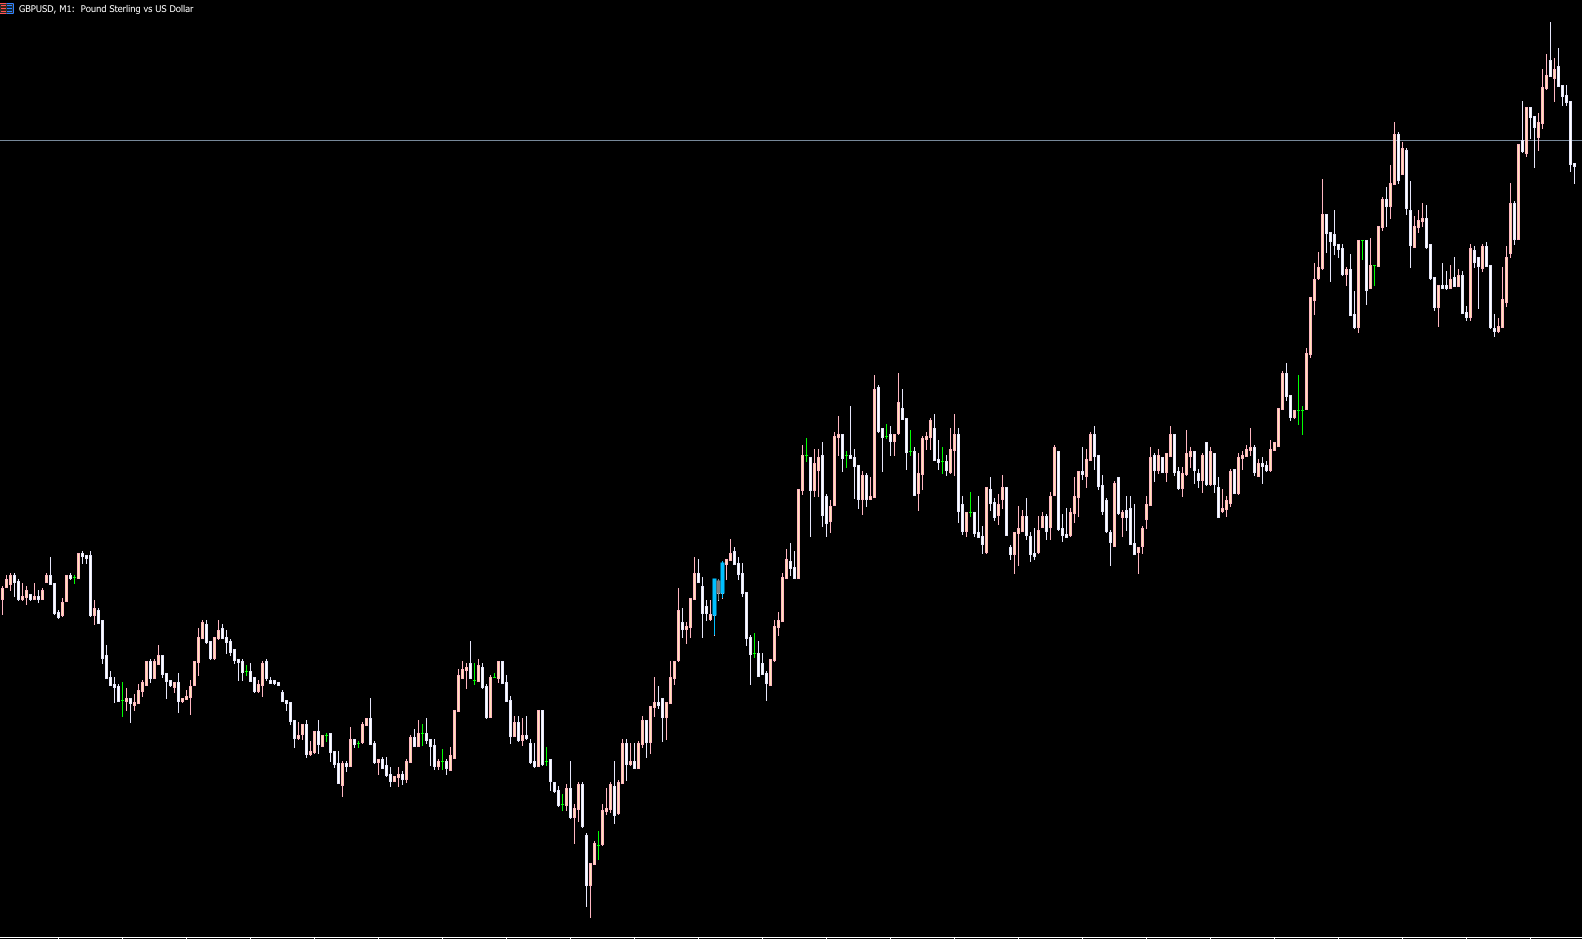
The RBR-DBD Indicator does not provide traditional buy or sell signals. Instead, it highlights zones of institutional interest—areas where price consolidated briefly before igniting a strong directional move.
Blue-highlighted base → Rally-Base-Rally (RBR), indicating a demand zone where buyers accumulated before an impulsive push upward.
Red-highlighted base → Drop-Base-Drop (DBD), signaling a supply zone where sellers created pressure before a continuation lower.
Traders typically watch for price to return to these highlighted zones. Upon retesting the base, reactions such as bounces, rejections, or strong candles can provide actionable trade entries. When combined with Market Structure, these zones also serve as strategic areas for stop-loss placement or confirmation of trend continuation.
Conclusion
The RBR-DBD Indicator for MT5 is an essential tool for traders incorporating supply and demand theory into their analysis. By marking key base formations that lead to impulsive movements, the indicator helps map out areas where institutional orders may be clustered. Whether you’re identifying entries on retests of these zones or using them as confluence in broader strategies, this indicator offers a structured and confident approach to technical trading.
FAQ
35 Downloads
Published:
Dec 08, 2025 03:26 AM
Category: