Mastering Future Momentum with the RDI Forecast Indicator
In the competitive landscape of technical analysis, the ability to anticipate market shifts before they occur is the ultimate edge. While most indicators are "lagging"—meaning they react to past Price Action—the RDI Forecast for MetaTrader is a forward-looking momentum oscillator designed to project potential future price trajectories. By analyzing current volatility and institutional flow, this indicator provides traders with a roadmap of where the "path of least resistance" lies.
What is the RDI Forecast?
The RDI (Relative Directional Index) Forecast is a specialized momentum tool that functions similarly to an optimized RSI or Stochastic but with a predictive mathematical twist. It filters out market noise to focus on the underlying trend's velocity.
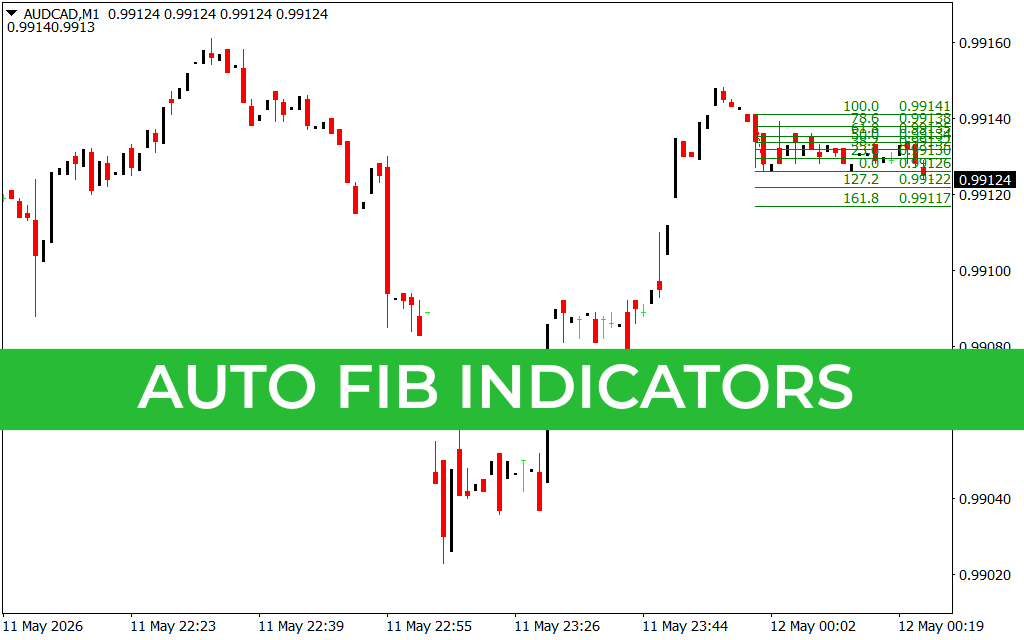
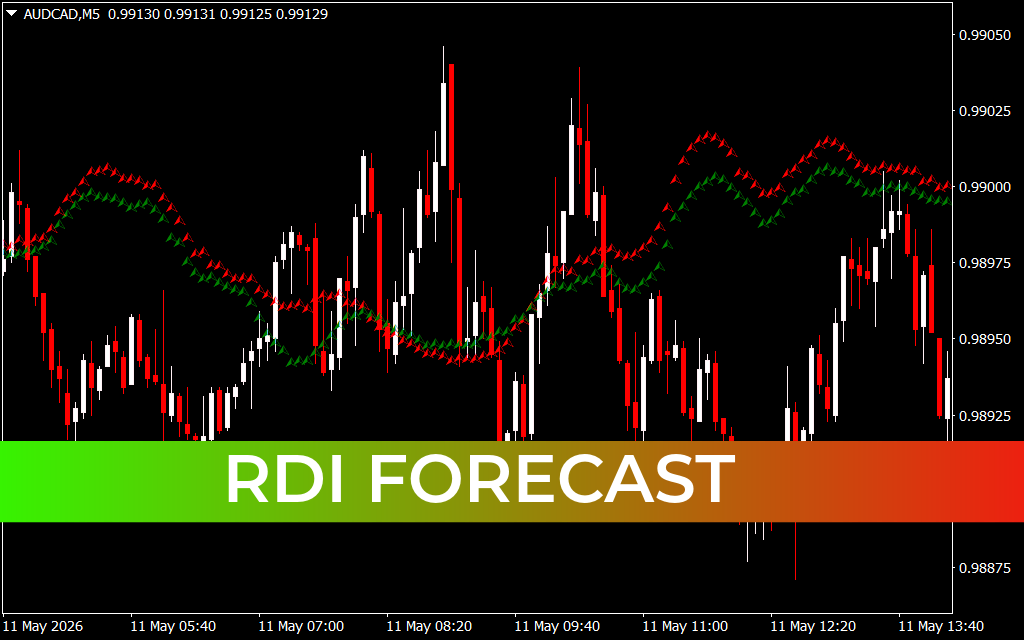
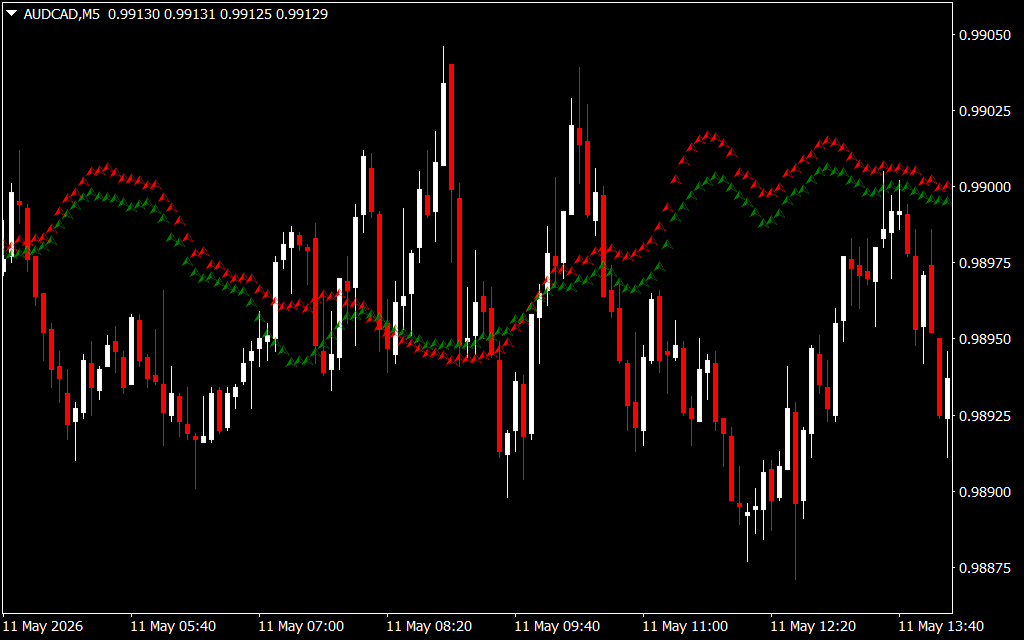
As seen on the AUD/CAD M1 chart, the indicator is presented in a sub-window featuring a dynamic, multi-colored signal line:
- Green Peaks: Indicate strong bullish momentum and potential continuation of an upward trend.
- Red Troughs: Signal heavy bearish pressure and the likelihood of further price declines.
- Threshold Levels: Much like traditional oscillators, the RDI Forecast uses horizontal boundaries (typically at the +1 and -1 levels) to define overextended market conditions.
Navigating Market Psychology
The core strength of the RDI Forecast lies in its "In-depth Scoring" logic. Instead of a simple percentage, it generates a volatility-weighted score that reflects the aggregate sentiment of the market.
- Trend Confirmation: When the indicator displays a clear "UpTrend" or "DownTrend" label alongside a rising or falling signal line, it confirms that the current move has institutional backing.
- Anticipating Reversals: The predictive nature of the RDI Forecast shines during divergences. If price action makes a new high but the RDI Forecast line begins to flatten or dip, it provides an early warning that the "fuel" for the move is exhausting, allowing traders to exit early or prepare for a counter-trend setup.
- Filtering Flat Markets: During low-volatility periods, the RDI Forecast line will oscillate tightly around the 0.00 median. This visual cue tells disciplined traders to stay on the sidelines until a clear momentum breakout occurs.
Strategic Integration
The RDI Forecast is exceptionally powerful when used as a secondary filter for price action strategies. For example, if a trader identifies a "Pin Bar" at a major support level, they can look to the RDI Forecast for confirmation. If the signal line is crossing above the -1 threshold simultaneously, the probability of a successful reversal increases exponentially.
For scalpers on lower timeframes like the M1 or M5, the responsiveness of the RDI Forecast is invaluable. It provides the "at-a-glance" data needed to make split-second decisions in fast-moving markets, ensuring you are always trading with the current of the market rather than against it.
2 Downloads
Last Update:
May 12, 2026 03:45 AM
Published:
Jan 23, 2026 22:28 PM
Category: