Decoding Market Volatility with the Rel Voll DX Indicator
In the high-stakes environment of Forex and CFD trading, price movement alone rarely tells the full story. To distinguish between a sustainable trend and a temporary "fake-out," professional traders look to volume and volatility. The Rel Voll DX (Relative Volatility Index) is a specialized technical tool designed to measure the velocity and magnitude of price changes, providing a critical filter for identifying high-probability trading opportunities.
The Science of Relative Volatility
Unlike standard volatility indicators that merely track price range, the Rel Voll DX focuses on the relative strength of price fluctuations over a specific period. It functions as an oscillator, typically ranging between 0 and 100, which allows traders to gauge whether the market is entering a state of expansion or contraction.
- High Values (Above 70/80): When the Rel Voll DX line climbs toward the upper threshold, it indicates that the market is experiencing intense directional volatility. This often coincides with the "meat" of a strong trend where momentum is at its peak.
- Low Values (Below 20/30): Low readings suggest a period of market "calm" or consolidation. While these periods are often quiet, they are frequently the precursors to explosive breakouts.
Precision Scalping on the M1 Chart
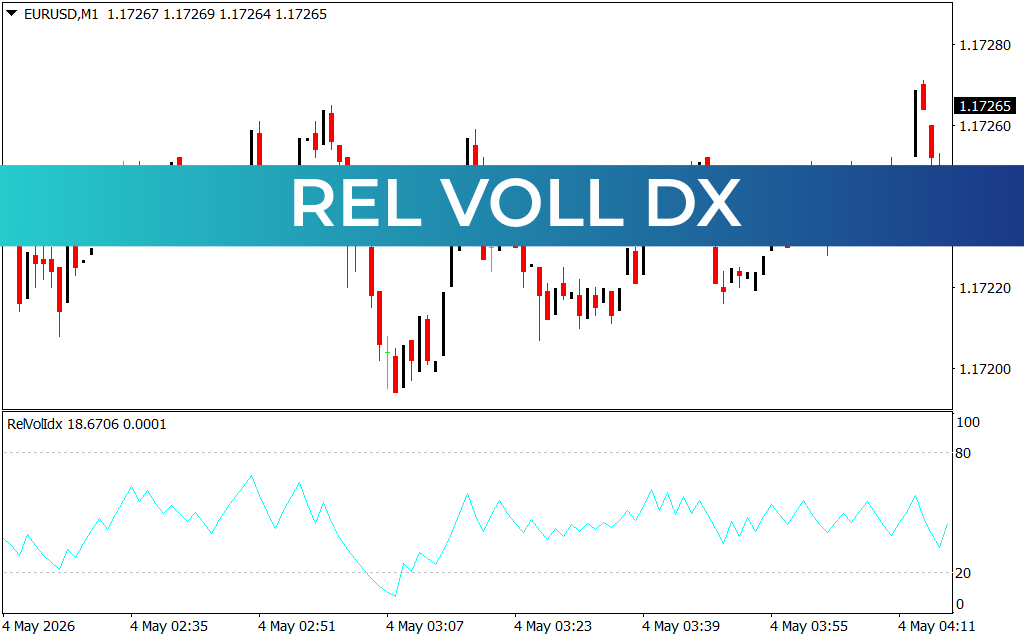
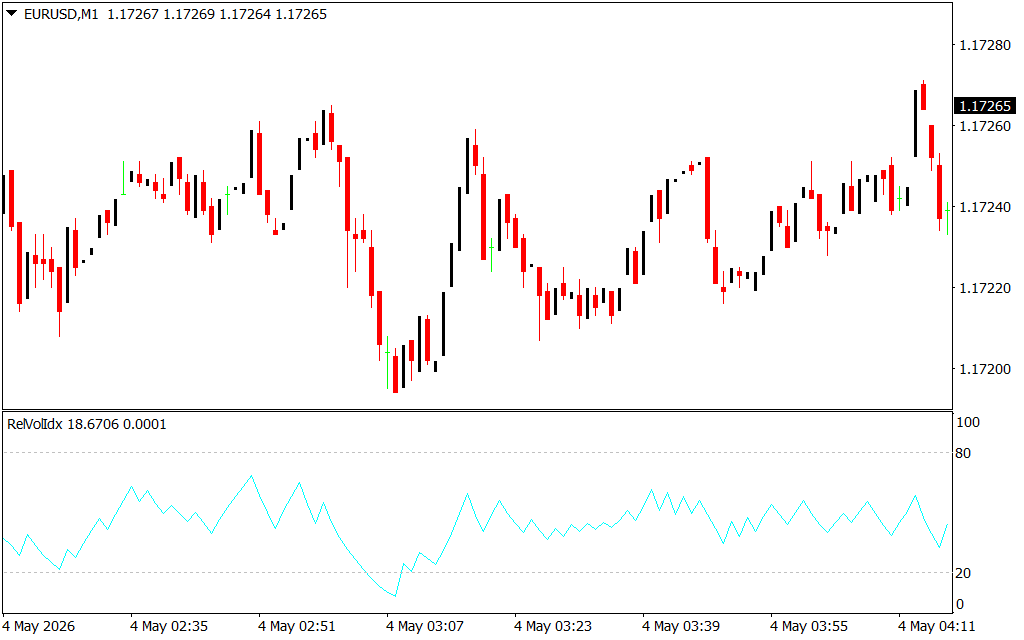
As demonstrated in the EURUSD M1 chart, the Rel Voll DX acts as a powerful "activity monitor." On the 1-minute timeframe, Price Action can often appear erratic and noisy. By utilizing the Rel Voll DX in the sub-window, traders can instantly see whether a price spike is backed by significant volatility or if it is a low-liquidity anomaly.
Notice how the peaks in the indicator line often align with the most aggressive candle movements. For a scalper, this is invaluable information. Entering a trade when the Rel Voll DX is rising ensures that you are trading during periods of high participation, which is essential for hitting take-profit targets quickly and avoiding stagnant, sideways markets that eat away at capital through spreads and swap fees.
Strategic Integration for Maximum Edge
The Rel Voll DX is most effective when used as a confirmation layer for directional strategies:
- Breakout Confirmation: If price breaks out of a consolidation zone or a chart pattern, look for a corresponding spike in the Rel Voll DX. If the indicator remains flat, the breakout lacks the volatility required to sustain a move.
- Trend Exhaustion: When the indicator reaches extreme highs and begins to roll over, it often signals that the current trend has reached its volatility peak and is likely to enter a cooling-off period or a reversal.
- Dynamic Filtering: Use it to stay out of the market during "dead zones." If the line is trending below 20, the market lacks the necessary movement to justify the risk of a new position.
By providing a clear, mathematical view of market participation and price velocity, the Rel Voll DX removes the guesswork from technical analysis. It ensures that every trade you take is backed by the volatility needed to reach your targets, transforming your charts into a professional-grade roadmap for consistent market success.
1 Download
Last Update:
May 04, 2026 10:31 AM
Published:
Jan 28, 2026 17:19 PM
Category: