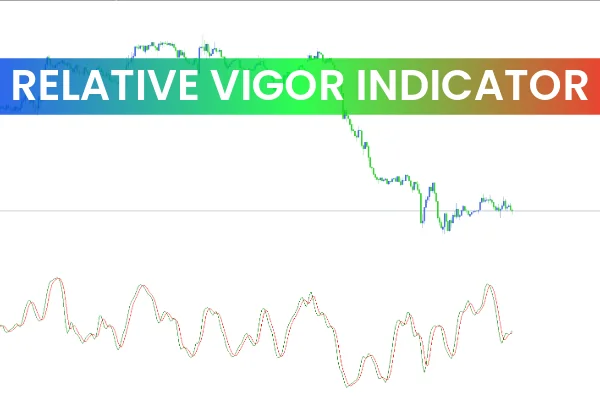
The Relative Vigor Index (RVI) is a powerful Trend Strength indicator that measures the “vigor” or energy behind a price movement. It operates on the principle that prices tend to close near their highs during uptrends and near their lows during downtrends.
By comparing closing prices to trading ranges, RVI helps traders determine whether current momentum is strong enough to sustain a trend — or if a reversal might be approaching.
This makes RVI an ideal tool for identifying trend continuation, momentum shifts, and potential turning points in the market.
How the RVI Indicator Works
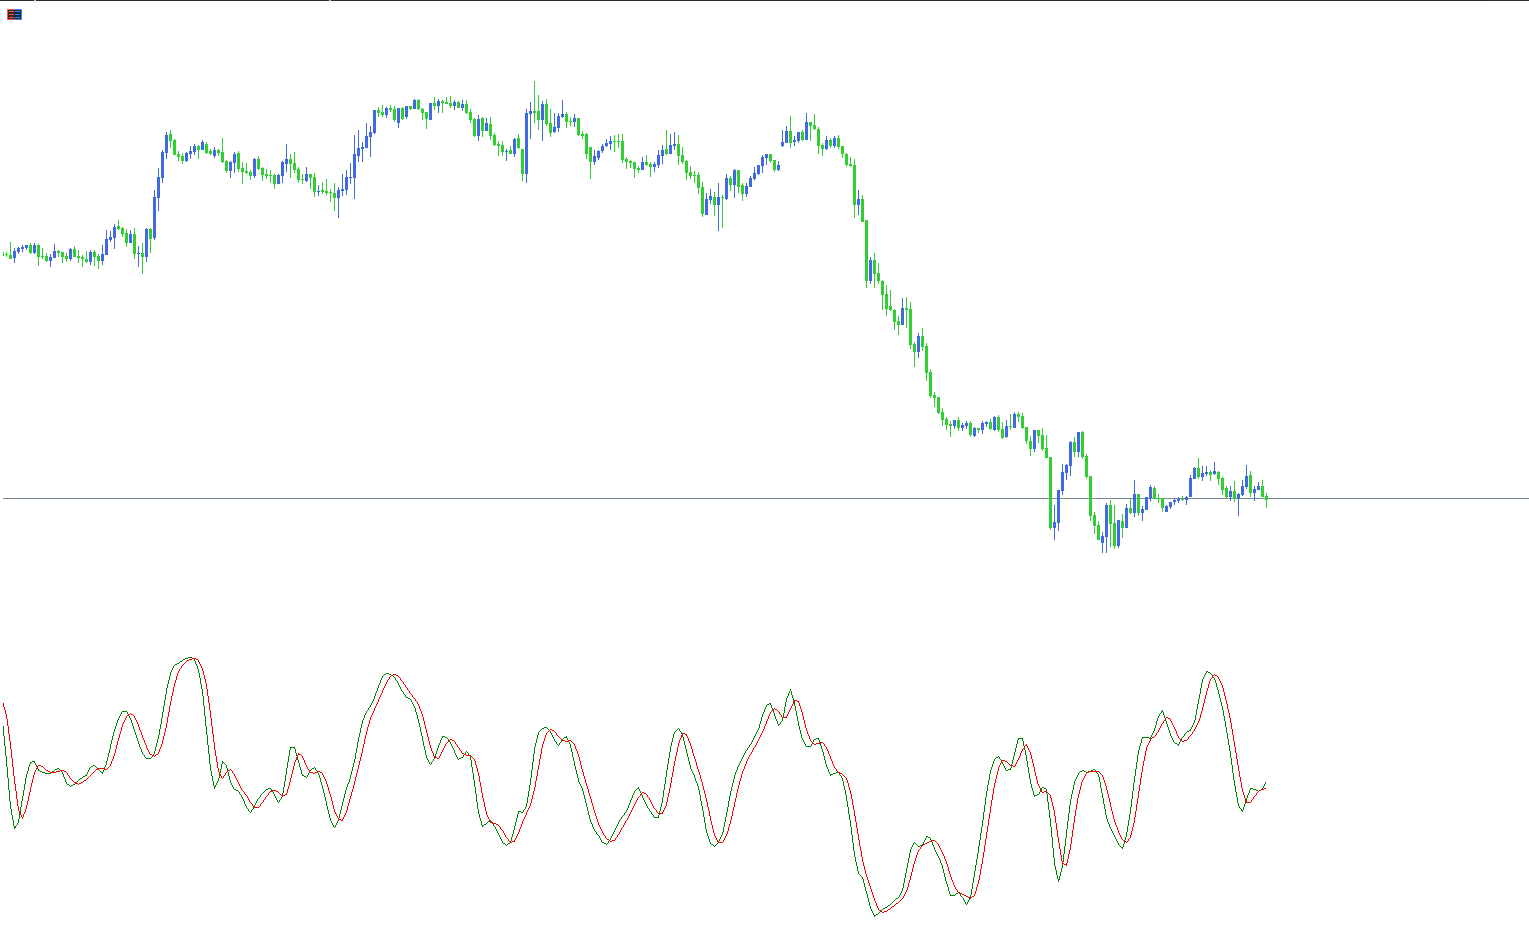
The RVI consists of two lines:
Main Line (Green) – Represents the normalized difference between closing prices and their moving average.
Signal Line (Red) – A moving average of the main line, used to confirm momentum direction.
The indicator oscillates between 0 and 100, with neutral momentum around the 50 level.
When the RVI main line is above the signal line, it signals bullish strength.
When the RVI main line is below the signal line, it indicates bearish weakness.
Relative Vigor Index (RVI) Trading Signals
The RVI provides clear buy and sell signals based on the relationship between its two lines and specific threshold levels:
Buy Signal
The RVI line crosses above 20 from below, indicating growing bullish momentum.
The main (green) line moves above the signal (red) line.
Price Action confirms upward strength — ideally supported by another indicator such as RSI or MACD.
Sell Signal
The RVI line crosses below 80 from above, signaling weakening bullish momentum.
The main (green) line drops below the signal (red) line.
Confirmation from other bearish indicators or resistance levels enhances signal accuracy.
Exit / Take Profit Signal
The RVI line crosses back below 80 after a bullish run, or rises above 20 after a bearish move.
This indicates a potential trend change or exhaustion of the current momentum.
How to Interpret the RVI Indicator
The RVI is not just a momentum gauge — it’s also a reversal confirmation tool.
Here’s how to interpret its signals effectively:
When the green line (RVI) stays consistently above the red line (signal), it shows sustained bullish strength.
When the red line remains above the green line, it suggests bearish momentum is dominating.
Values near 50 typically indicate sideways or neutral market conditions.
RVI works especially well when combined with other trend-following indicators such as Moving Averages, Bollinger Bands, or MACD, allowing traders to filter out false signals during consolidation phases.
RVI Trading Example
Let’s say EUR/USD is showing strong upward momentum. The RVI line crosses above the signal line and moves past the 20 level from below — confirming a buy opportunity.
As the pair continues upward and RVI approaches the 80 mark, traders can tighten stop losses or prepare to take profit when RVI begins to decline back below 80.
This simple approach helps traders enter early during trend formation and exit efficiently before reversals.
Why Use the Relative Vigor Index (RVI)?
Momentum Confirmation: Confirms the strength behind a trend.
Reversal Detection: Identifies potential turning points before they happen.
Trend Filter: Works across multiple timeframes to filter noise.
Versatility: Can be used in Forex, indices, stocks, and commodities trading.
Easy Integration: Combines well with oscillators like RSI, Stochastic, or MACD for stronger signal confirmation.
Conclusion
The Relative Vigor Index (RVI) Indicator for MT4 is a reliable and versatile technical tool that helps traders assess market momentum, trend strength, and potential reversal points.
By analyzing the relationship between price and closing levels, RVI allows traders to anticipate momentum shifts and improve timing for entries and exits.
Whether used alone or in combination with other indicators, the RVI can significantly enhance trading accuracy and profitability.
Download the RVI Indicator for MT4 today at IndicatorForest.com and bring more clarity to your market analysis.
FAQ
The Relative Vigor Index (RVI) measures the strength of a trend by comparing closing prices to opening prices and normalizing the result. It helps identify whether buying or selling pressure is stronger, providing insights into trend strength and potential reversals through momentum analysis.
When RVI is above zero and rising, it indicates strong buying pressure and bullish momentum. When RVI is below zero and falling, it suggests strong selling pressure and bearish momentum. RVI crossovers above or below zero can signal potential trend changes and entry opportunities.
RVI focuses on the relationship between closing and opening prices rather than price changes alone, making it particularly useful for identifying trend strength. It provides a different perspective on momentum that can complement RSI and other oscillators, especially in trending markets.
Use RVI to confirm trend direction and identify momentum strength. Enter long trades when RVI crosses above zero and continues rising, and enter short trades when RVI crosses below zero and continues falling. Combine with trend indicators or support/resistance levels for confirmation.
Yes, Relative Vigor Index works on all MT4 timeframes and currency pairs. It is suitable for scalping, day trading, and swing trading, though many traders find it most effective on H1 and H4 charts where momentum signals are clearer and more reliable.
3 Downloads
Published:
Nov 05, 2025 09:37 AM
Category: