Navigating Volatility: The Renko V1 Indicator for MT4
In the modern trading era, the biggest challenge isn't a lack of information—it’s an excess of noise. Standard candlestick charts often present a chaotic view of the market, making it difficult to distinguish between minor price fluctuations and actual trend reversals. The Renko V1 indicator for MetaTrader 4 (MT4) is designed to solve this by bringing the clarity of brick-based charting directly onto your standard time-based candles.
The Logic Behind Renko V1
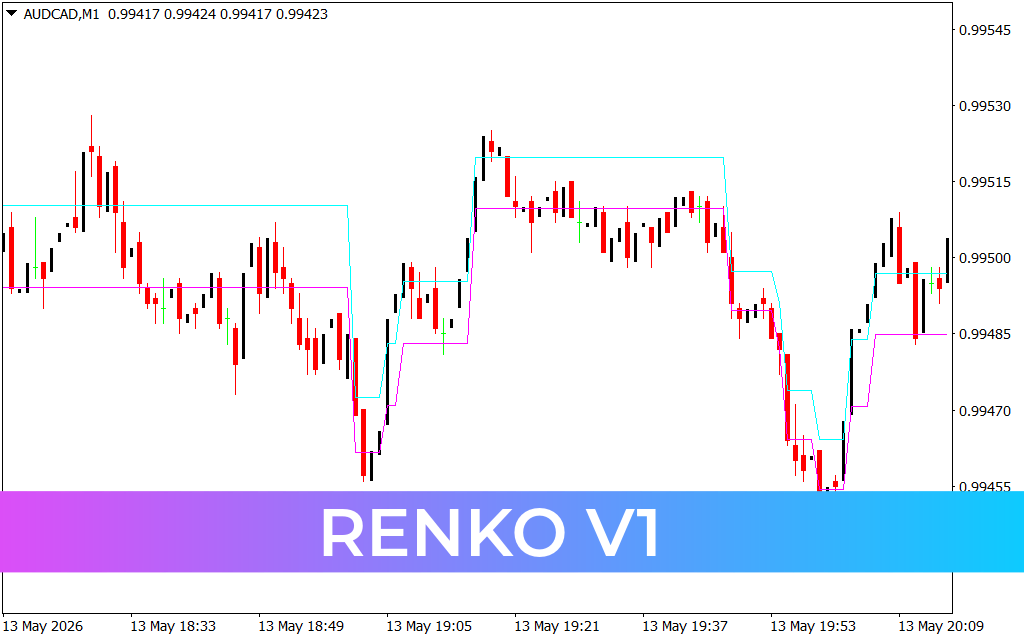
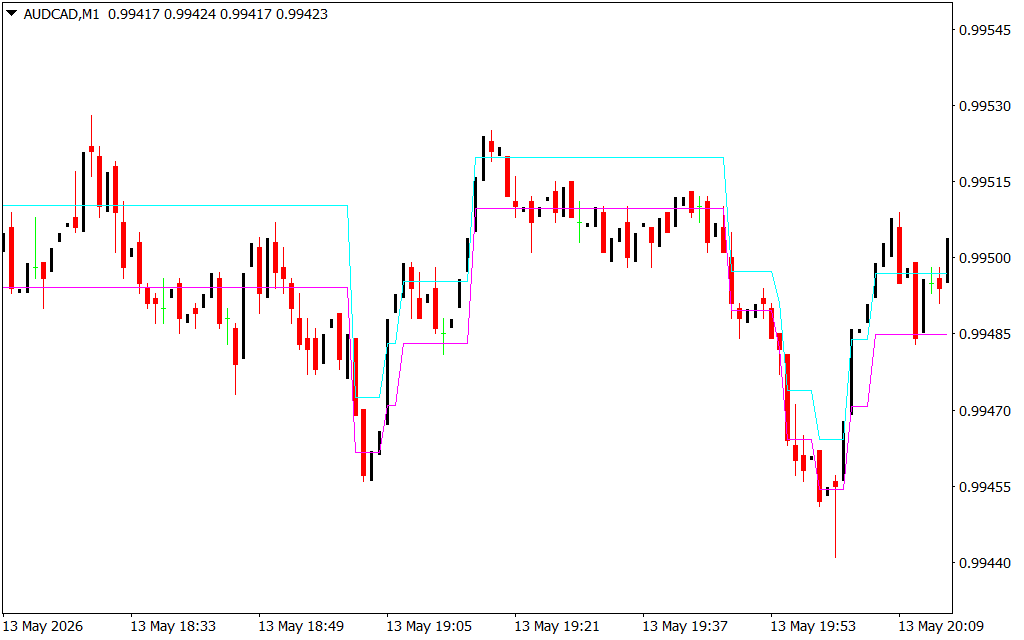
Renko charts traditionally ignore time and focus purely on price movement. The Renko V1 indicator translates this methodology into a visual overlay, creating "step-like" Support And Resistance levels. As seen in the AUD/CAD M1 chart, the indicator plots a cyan upper boundary and a magenta lower boundary.
These lines do not curve like a moving average; they move in discrete increments. This "stepped" nature allows traders to see exactly where the market has established a new price floor or ceiling. When the price stays between these two bounds, the market is in a consolidation phase. When the price breaks and closes outside of these steps, it signals a high-probability breakout.
Why the Renko V1 is a Game Changer
Most technical indicators lag significantly because they are tied to time-close data. Renko V1 prioritizes Price Action, offering several strategic advantages:
- Noise Reduction: By focusing on specific price movements, it filters out the "whipsaws" that often trigger stop-losses prematurely in volatile markets.
- Clear Support and Resistance: The horizontal nature of the cyan and magenta lines provides immediate visual targets for placing stop-losses or identifying take-profit zones.
- Trend Confirmation: A series of rising steps (higher highs and higher lows) provides a mechanical way to stay in a trend, while a sudden "drop" in the steps serves as an early warning for a Trend Reversal.
- Optimized for Scalping: On lower timeframes like the M1, the Renko V1 helps traders identify micro-trends that are often invisible on standard charts, making it a favorite for high-frequency scalpers.
Trading the Breakout
To effectively use Renko V1, watch for the "staircase" effect. In the provided AUD/CAD example, when the price pushes above the cyan line and the indicator shifts its level upward, it confirms bullish intent. Conversely, when the price crashes through the magenta floor—as seen during the sharp descent toward 19:53—it confirms that the bears have taken control, providing a clear signal to exit longs or enter short positions.
8 Downloads
Last Update:
May 14, 2026 01:59 AM
Published:
Jan 22, 2026 15:05 PM
Category: