Mastering Market Turns with the Reversal Trend With Donchian Band Indicator
In the high-stakes world of Forex trading, identifying the exact moment a trend exhausts itself and begins to reverse is the ultimate goal. While many traders chase momentum, the most profitable opportunities often lie in catching a new trend at its inception. The Reversal Trend With Donchian Band system is a specialized technical tool designed to pinpoint these pivotal market shifts by combining volatility channels with trend-reversal logic.
Understanding the Donchian Band Foundation
Developed by Richard Donchian, the "father of trend following," Donchian Bands are a classic Volatility Indicator. They consist of an upper band (the highest high over a set period) and a lower band (the lowest low). The space between these bands represents the market's trading range.
The Reversal Trend With Donchian Band indicator enhances this concept. Instead of just showing price extremes, it uses the bands as "breakout zones." When the price breaches the upper or lower boundary after a period of consolidation, it signals that the previous trend has likely ended and a new directional move is beginning.
Key Features and Visual Interpretation
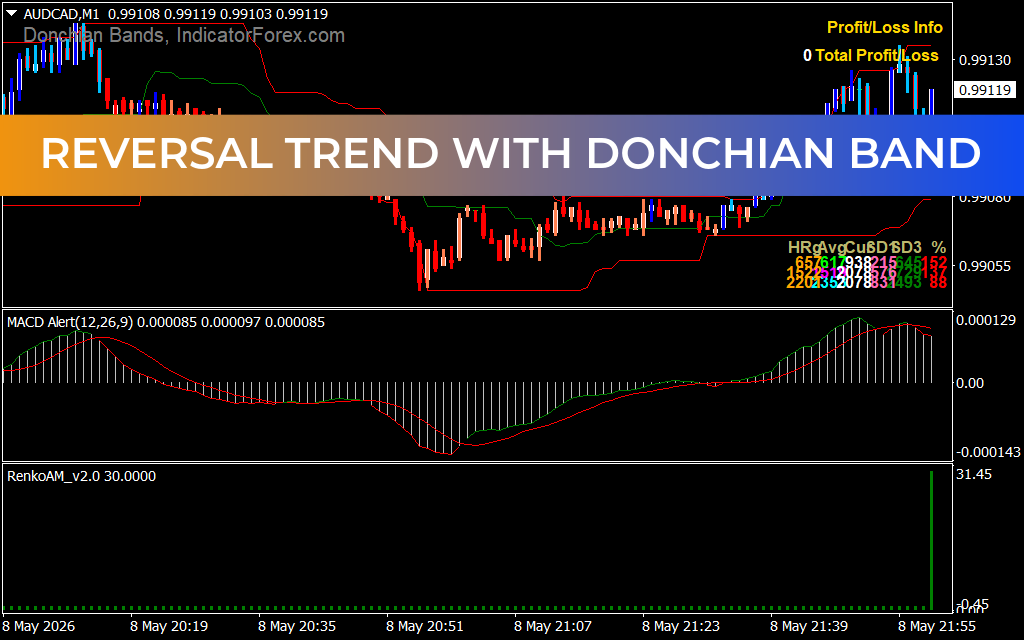
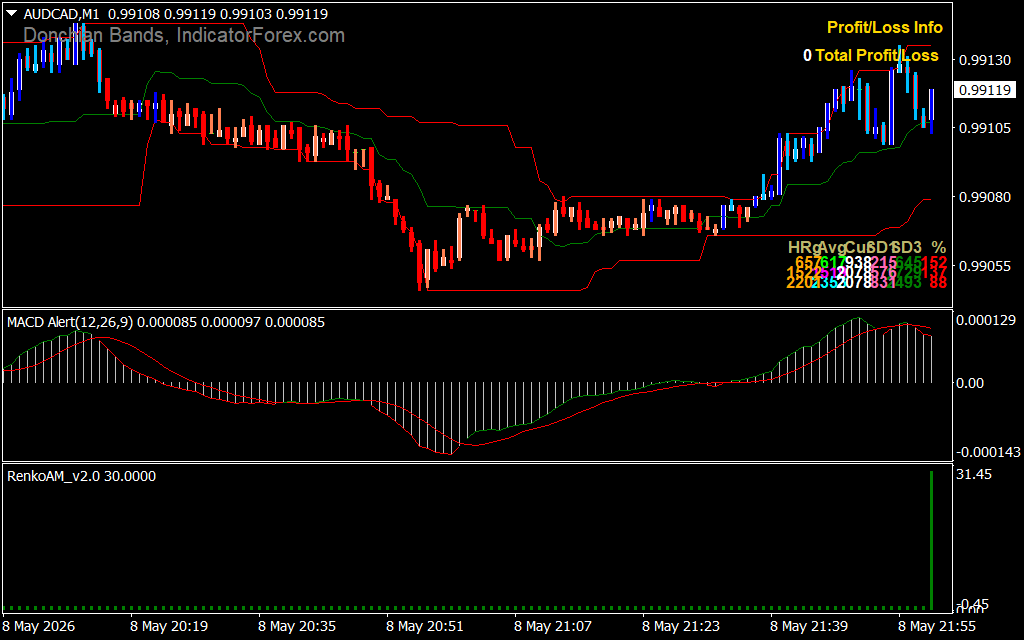
As demonstrated in the uploaded AUDCAD M1 chart, this indicator provides a multi-layered view of the market:
- Step-Like Volatility Channels: The Donchian Bands appear as structured, red-lined boundaries. These "steps" highlight key Supply And Demand levels. A "step up" in the lower band indicates rising support, while a "step down" in the upper band indicates falling resistance.
- Color-Coded Trend Confirmation: The system often includes a price-action filter that changes the color of the candles or a central signal line. As seen in the example, bullish reversals are marked by a transition to blue candles, while bearish shifts are signified by red candles.
- Confluence with MACD Alert: This specific setup frequently integrates a MACD histogram in a sub-window. By waiting for a Donchian Band breakout to align with a MACD crossover, traders can filter out "fakeouts" and focus on high-conviction setups.
- Profit/Loss Tracking: Many versions of this indicator include an on-screen dashboard that tracks real-time statistics, helping traders maintain a disciplined approach to risk management.
Strategic Implementation for Reversal Trading
Trading reversals requires patience and a strict set of rules. Here is how to use the Reversal Trend With Donchian Band effectively:
- Identify the Extreme: Wait for the price to touch or penetrate one of the outer Donchian Bands. This suggests the market is overextended.
- Wait for the "Flip": Do not enter just because a band is touched. Wait for the indicator to signal a reversal—usually when a candle closes back inside the bands and changes color (e.g., from red to blue).
- Confirm with Momentum: Look at the MACD sub-window. If the price is breaking the upper Donchian Band and the MACD histogram has crossed above the zero line, the reversal is confirmed by momentum.
- Set Logical Stops: Place your stop-loss just outside the opposite Donchian Band. This uses the market’s own volatility to protect your trade.
Conclusion
The Reversal Trend With Donchian Band is a professional-grade indicator that simplifies the complex task of picking market tops and bottoms. By grounding your strategy in the reality of volatility and price extremes, it helps you avoid the "noise" of the lower timeframes. Whether you are Scalping the M1 or swing trading the H4, this tool provides the structural clarity needed to trade reversals with confidence.
5 Downloads
Last Update:
May 09, 2026 12:17 PM
Published:
Jan 25, 2026 12:07 PM
Category: