Navigate Global Markets with Precision Using the Road Map V04 Indicator for MT4
In the fast-moving landscape of Forex trading, having a clear sense of direction is the difference between consistent profitability and mounting losses. Many retail traders get lost in "market noise," reacting to minor price fluctuations rather than following the structural flow of institutional money. The Road Map V04 Indicator for MetaTrader 4 (MT4) is a professional-grade technical solution designed to act as a GPS for your trading platform. By synthesizing complex trend algorithms with advanced smoothing techniques, it provides a definitive visual "path" for Price Action.
The Logic of a Trend-First Approach
The Road Map V04 is built on the philosophy that the trend is not just a direction, but a structural cycle. This indicator uses a proprietary multi-layered algorithm to identify the dominant market regime, filtering out the erratic "whipsaws" that often trigger premature stop-losses. Unlike standard lagging moving averages, Version 04 features enhanced responsiveness, allowing it to pivot quickly at the onset of a new market phase.
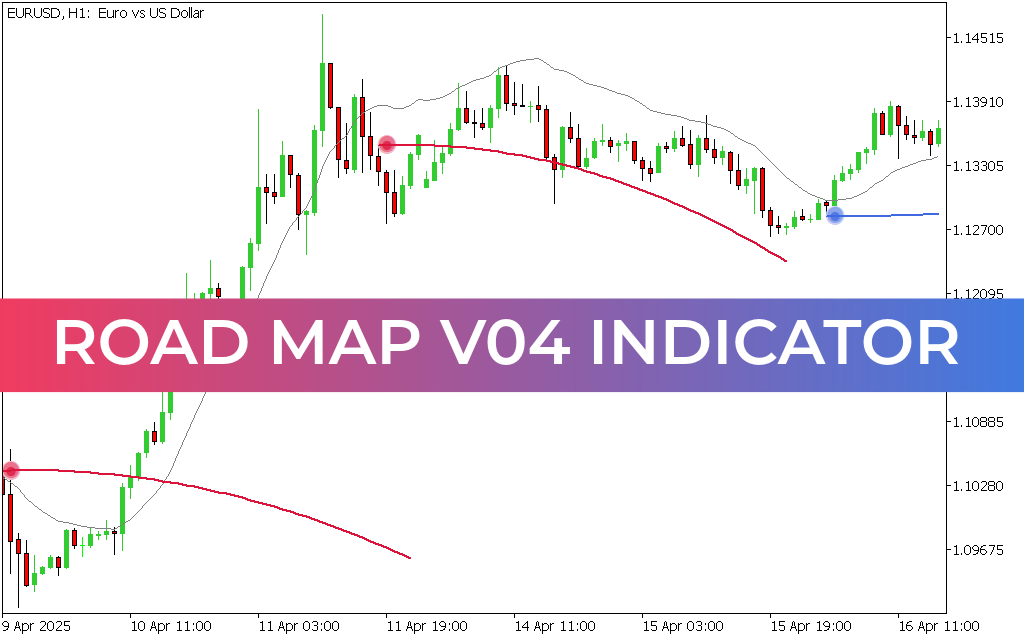
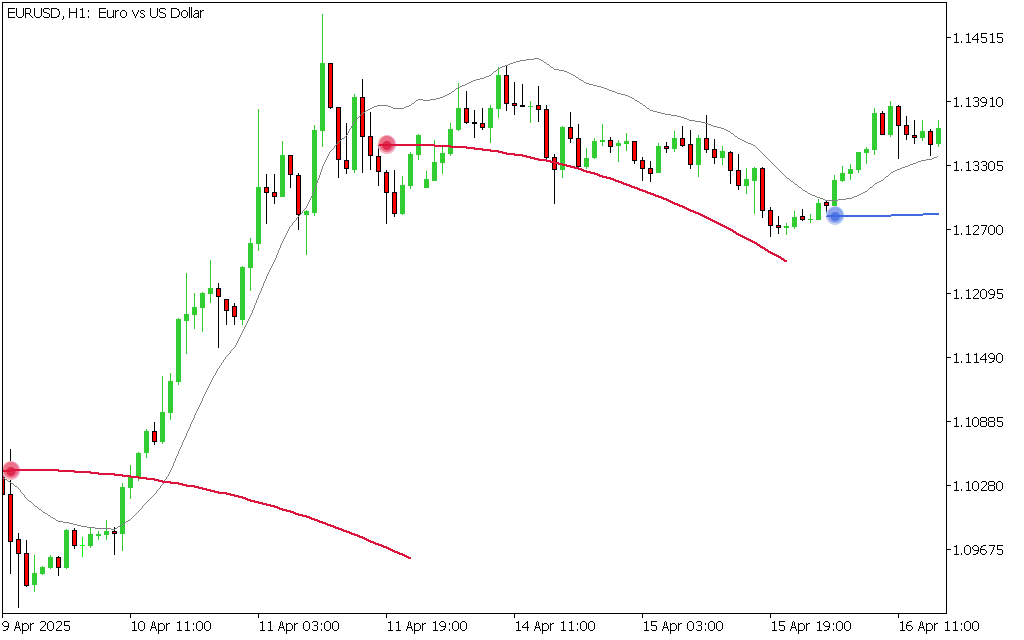
As demonstrated in the recent EUR/USD H1 chart analysis, the Road Map V04 provides a sophisticated visual framework:
- The Dual-Color Trend Ribbon: The central feature of the indicator is its color-changing trend line. A shift to green signals that the market has entered a confirmed bullish regime, while a shift to red warns of a dominant bearish trend.
- Price Magnetism and Deviation: The indicator tracks how far price "stretches" from the central road map. When price deviates too far from the green or red line, it signals an overextended market, warning traders to prepare for a mean-reversion move or a period of consolidation.
- Institutional Smoothing: The V04 update includes a refined smoothing filter that ensures the "road map" remains stable during low-liquidity sessions, preventing the false signals common during Asian market hours.
Strategic Advantages for Professional Traders
The Road Map V04 Indicator is an essential asset for traders who prioritize objective, data-driven execution over emotional guesswork.
- Objective Entry and Exit Points: The indicator removes the ambiguity of "when to enter." A simple color change provides a primary signal, which can be combined with price action for a high-confluence entry.
- Trend-Following Discipline: By visually carving out the "road" price is likely to follow, the indicator helps traders stay in winning positions longer. As long as the line remains green, the bullish bias is intact, preventing the common mistake of "cutting winners too short."
- Enhanced Risk Management: The Road Map V04 provides a logical area for stop-loss placement. By trailing your stop-loss slightly behind the indicator’s trend line, you protect your capital while allowing the trade enough breathing room to develop.
- Versatility Across Assets: While exceptionally powerful on major pairs like EUR/USD, the Road Map V04 is designed to adapt to the volatility of commodities, indices, and crypto, making it a universal tool for the modern portfolio.
Conclusion
The Road Map V04 Indicator for MT4 is a definitive upgrade for any technical analyst seeking structural clarity. By providing a clear, color-coded roadmap of market direction and momentum, it empowers you to navigate the global markets with the confidence of a professional. Elevate your MT4 platform today and start trading with a clear view of the road ahead.
28 Downloads
Last Update:
Apr 16, 2026 14:42 PM
Published:
Feb 10, 2026 19:59 PM
Category: