Master Psychological Levels with the Round Price Two Color Indicator
In the psychological arena of financial markets, certain price levels hold more weight than others. Professional traders have long recognized that "round numbers"—levels ending in .00, .50, or .000—act as natural magnets for Price Action, serving as pivotal zones for support, resistance, and institutional order flow. The Round Price Two Color Indicator is a sophisticated technical tool designed to highlight these critical zones while providing immediate visual feedback on trend momentum.
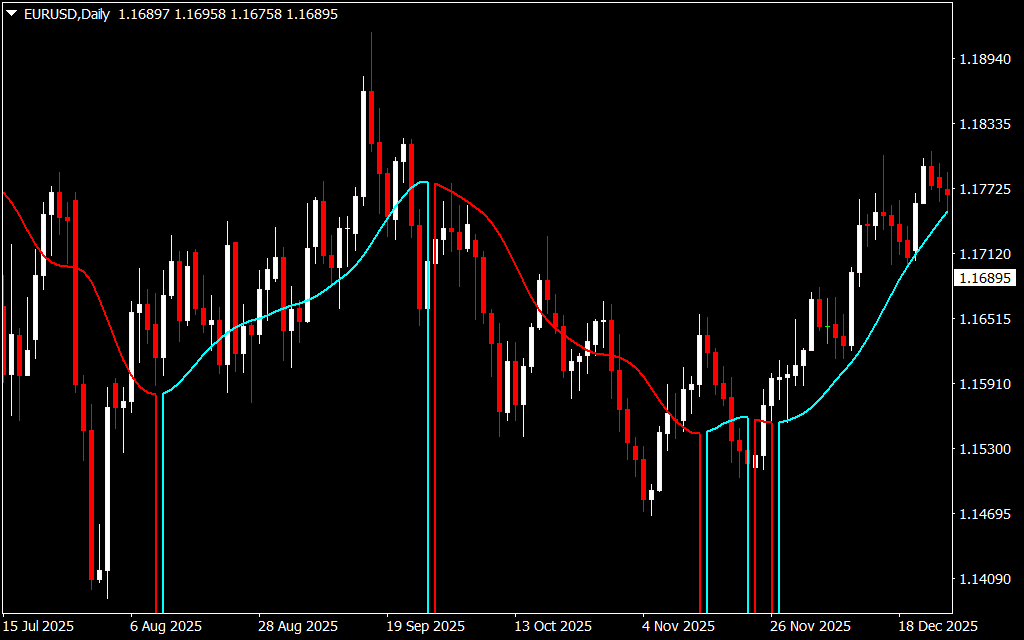
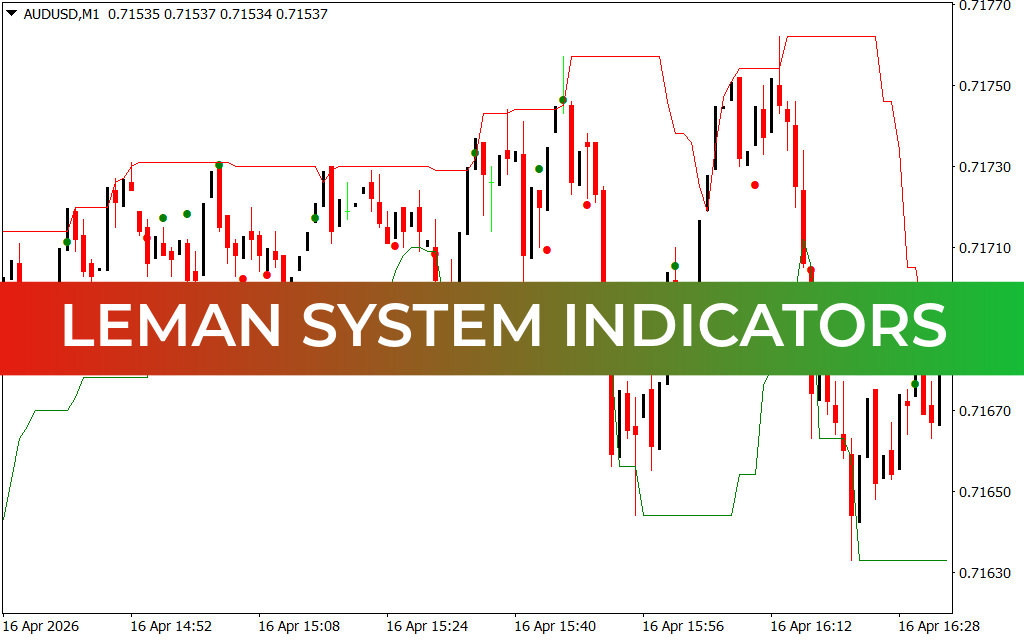
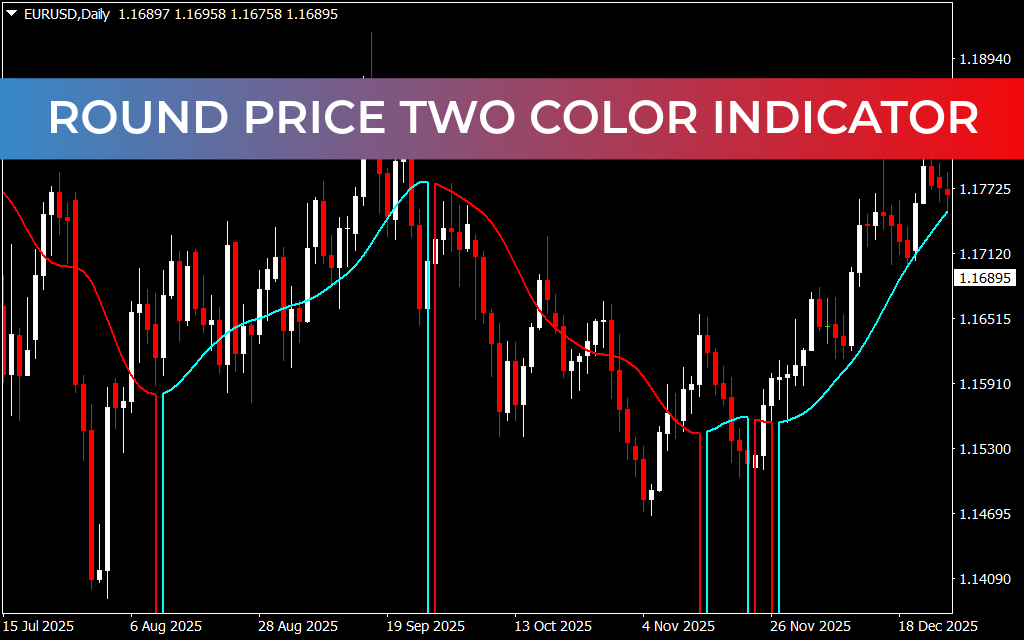
As demonstrated in the file EURUSDDaily.png, this indicator streamlines technical analysis by overlaying a dynamic, color-coded curve directly onto the price action. By identifying how price interacts with significant psychological levels, traders can filter out market noise and focus on high-probability setups.
Understanding the Two-Color Logic
The primary strength of the Round Price Two Color Indicator lies in its visual simplicity. Unlike traditional moving averages that can be ambiguous, this indicator uses a distinct dual-color system to signal market sentiment:
- Bullish Momentum (Cyan): When the indicator line turns cyan, as seen in the latter half of EURUSDDaily.png, it signals that the bulls are in control and price is successfully holding above a key psychological threshold.
- Bearish Momentum (Red): A transition to red indicates that selling pressure is dominant and price is struggling to maintain its footing near round price levels, suggesting a potential downtrend or correction.
This color-shifting mechanism allows traders to gauge the "health" of a trend at a single glance, making it an essential tool for both scalpers and swing traders.
Why Round Prices Matter
Markets are driven by human emotion and institutional algorithms. Large banks and hedge funds often place their "take profit" and "stop loss" orders at round numbers because they are easy to remember and act as natural barriers.
When you use the Round Price Two Color Indicator, you aren't just following a mathematical formula; you are tracking the behavior of the "Big Boys." As evidenced in EURUSDDaily.png, price often reacts sharply when it touches these color-coded zones. By combining these levels with the indicator's color cues, you can enter trades with tighter stops and clearer profit targets.
Trading Strategy: The Color Flip
One of the most effective ways to use this tool is the "Color Flip" strategy. Look for instances in EURUSDDaily.png where the line switches from red to cyan. This transition often precedes a significant bullish run. Conversely, when the line snaps from cyan to red near a round price peak, it is a prime signal to look for shorting opportunities.
By integrating this indicator into your MetaTrader setup, you transform your chart from a chaotic mess of candles into a structured map of psychological Supply And Demand.
SEO Meta Description
2 Downloads
Last Update:
May 05, 2026 15:19 PM
Published:
Jan 27, 2026 20:33 PM
Category: