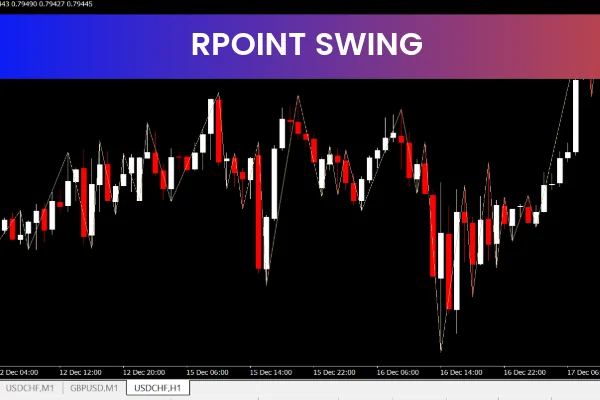
The RPoint Swing Indicator is a free and popular Forex indicator for the MetaTrader 4 platform, designed to help traders identify potential swing points in the market. By combining price action analysis with volatility measurements, the indicator provides a clear and visual way to understand Market Structure and potential turning points. This makes it especially useful for traders who focus on swing trading, trend reversals, and precise trade timing.
The RPoint Swing Indicator is easy to use, highly visual, and suitable for traders of all experience levels who want a better understanding of when price may change direction.
What Is the RPoint Swing Indicator
The RPoint Swing Indicator is a technical analysis tool that highlights potential market swing highs and swing lows. Swing points are areas where price temporarily stops moving in one direction and starts moving in the opposite direction. Identifying these points is essential for:
Swing trading strategies
Trend Continuation and reversal trading
Defining entry and exit levels
The indicator analyzes current Price Action, compares it with historical signal price behavior, and uses volatility to confirm the strength of each swing point.
How the RPoint Swing Indicator Works
The RPoint Swing Indicator uses two key components to detect swing points.
Price Action Analysis
The indicator monitors how price behaves relative to previous highs and lows. When price shows signs of slowing, stalling, or changing direction compared to earlier movements, a potential swing point is identified.
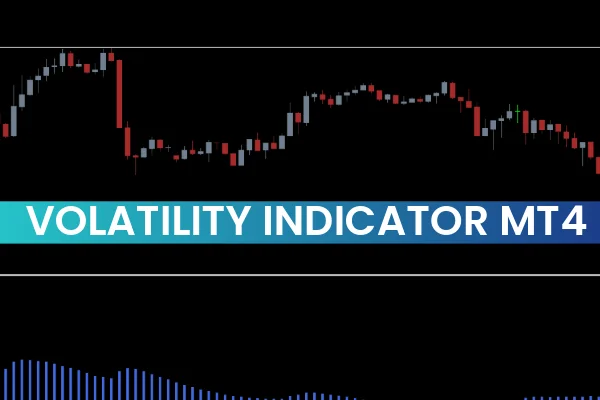
Volatility Confirmation
Volatility plays an important role in filtering weak signals. The indicator evaluates market volatility to confirm whether a potential swing point is significant or just minor price noise. This helps reduce false signals and improves overall accuracy.
Once confirmed, the indicator displays swing points directly on the chart, giving traders an immediate visual reference.
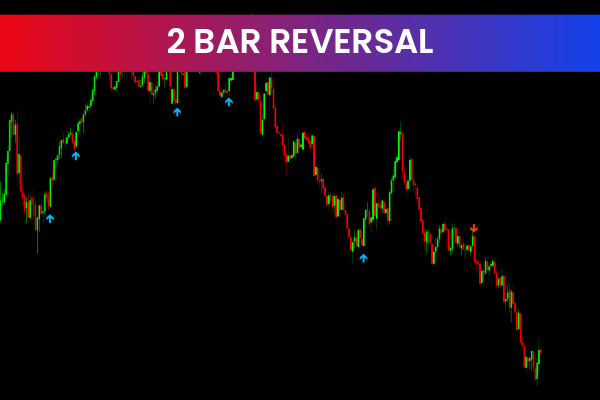
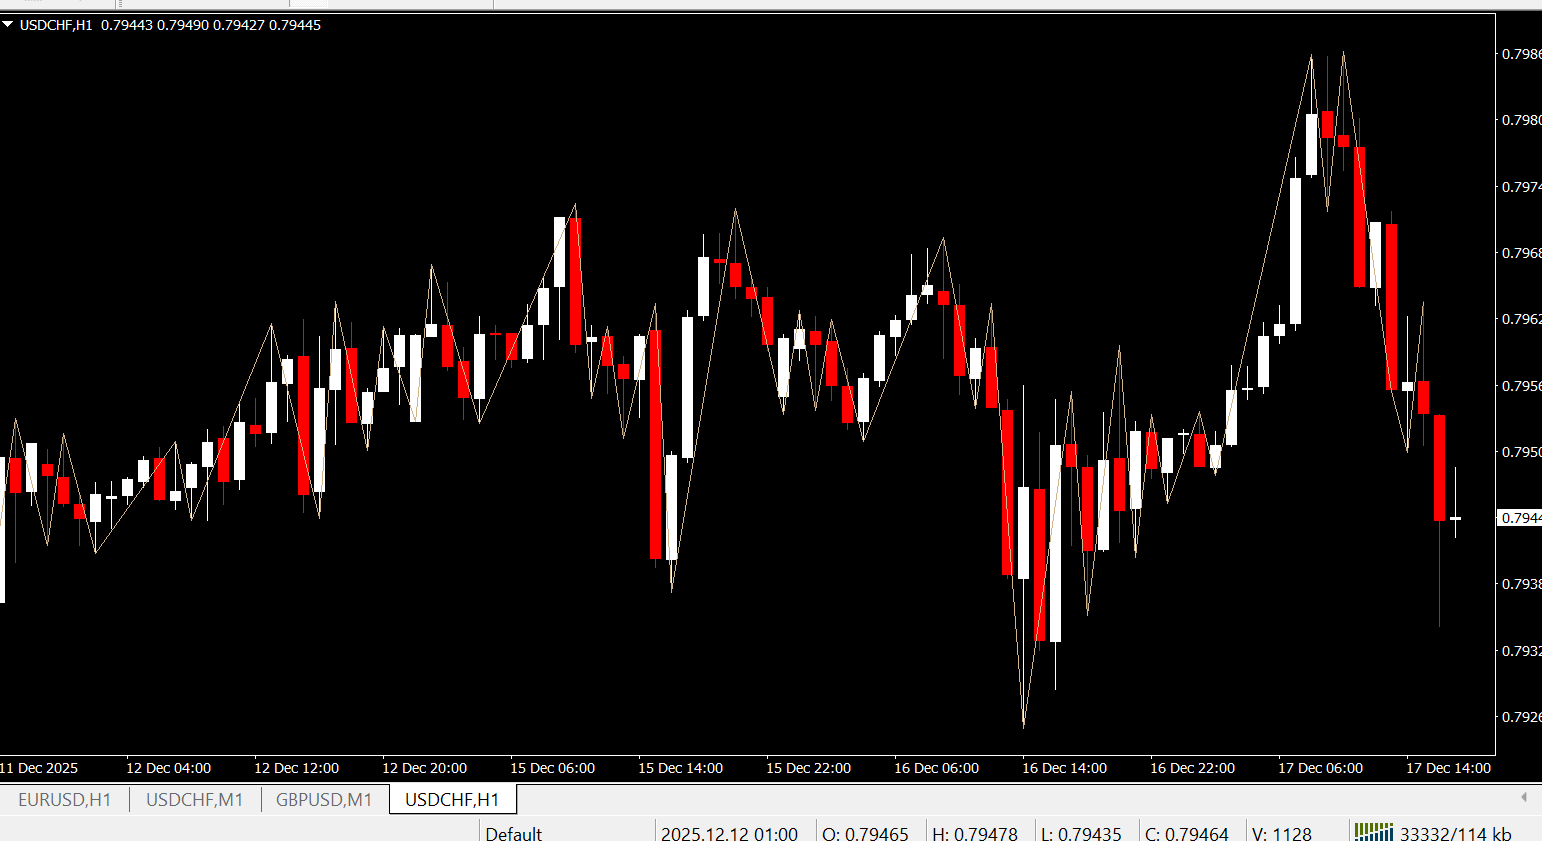
Visual Representation of Swing Points
One of the strongest features of the RPoint Swing Indicator is its clear visual display.
Swing highs and swing lows are marked directly on the chart
Traders can easily see market structure and price waves
Key turning points become more obvious
This visual clarity helps traders make faster and more confident trading decisions without overloading the chart with complex indicators.
Alerts and Customization Options
The RPoint Swing Indicator includes an alert system that notifies traders when a new swing point is detected. This is especially helpful for traders who monitor multiple currency pairs or timeframes.
Customization options allow traders to:
Adjust sensitivity based on market conditions
Fine-tune volatility settings
Match the indicator to their personal trading style
This flexibility makes the indicator useful for both conservative and aggressive trading approaches.
How to Trade Using the RPoint Swing Indicator
The RPoint Swing Indicator can be used in several effective trading strategies.
Swing Trading Entries
Buy trades may be considered near confirmed swing lows
Sell trades may be considered near confirmed swing highs
Using additional confirmation from trend or momentum indicators can improve trade accuracy.
Trend Reversal Identification
When swing points start forming against the current trend, it may indicate weakening momentum and a possible trend reversal. Traders can use this information to prepare for counter-trend trades or exit existing positions.
Trend Continuation Trades
In trending markets, the indicator helps identify pullbacks within the trend. Traders can enter in the direction of the main trend when price forms a swing point and resumes movement.
Support and Resistance Identification
Swing points identified by the RPoint Swing Indicator often align with key Support And Resistance levels.
Swing lows frequently act as support
Swing highs often act as resistance
This makes the indicator useful for mapping important price levels and planning risk management.
Best Timeframes and Market Conditions
The RPoint Swing Indicator works across all timeframes, but it is particularly effective on:
M15, H1, and H4 charts for swing trading
Trending or moderately volatile markets
Higher timeframes generally produce stronger and more reliable swing points.
Advantages of the RPoint Swing Indicator
Clear identification of swing highs and lows
Combines price action with volatility filtering
Visual and easy-to-read chart display
Alert system for new swing points
Free and compatible with MT4
These advantages make it a valuable tool for both beginner and advanced Forex traders.
Practical Trading Tips
For best results, traders often:
Use higher timeframe trends to define direction
Enter trades on lower timeframes using swing points
Combine the indicator with support and resistance or trend tools
This structured approach improves consistency and reduces false signals.
Final Thoughts
The RPoint Swing Indicator is a powerful and user-friendly MT4 tool for traders who want to identify potential swing points with greater clarity. By combining price action and volatility, it provides reliable visual signals that help traders time entries and exits more effectively.
If swing trading or market structure analysis is part of your Forex strategy, the RPoint Swing Indicator is a strong addition to your trading toolkit. Visit IndicatorForest.com to explore more free MT4 indicators and improve your Forex trading performance today.
FAQ
Rpoint Swing identifies swing highs and swing lows automatically, helping traders spot key reversal points and trend changes. It marks important price levels where the market is likely to react or reverse direction.
The indicator analyzes price action to detect local highs and lows, filters out minor fluctuations, and marks significant swing points that represent potential support/resistance levels or trend reversal zones.
Enter trades at swing points in the direction of the trend, use swing highs as resistance and swing lows as support, trade breakouts when price moves beyond swing points, and use them for stop-loss placement.
Automatic detection saves time compared to manual analysis, provides objective swing point identification, reduces human error, and helps identify key levels that might be missed during manual chart analysis.
Combine with trend indicators to trade in the right direction, use with momentum oscillators for confirmation, integrate with support/resistance levels, and combine with candlestick patterns for entry timing.
Published:
Dec 17, 2025 11:24 AM
Category: