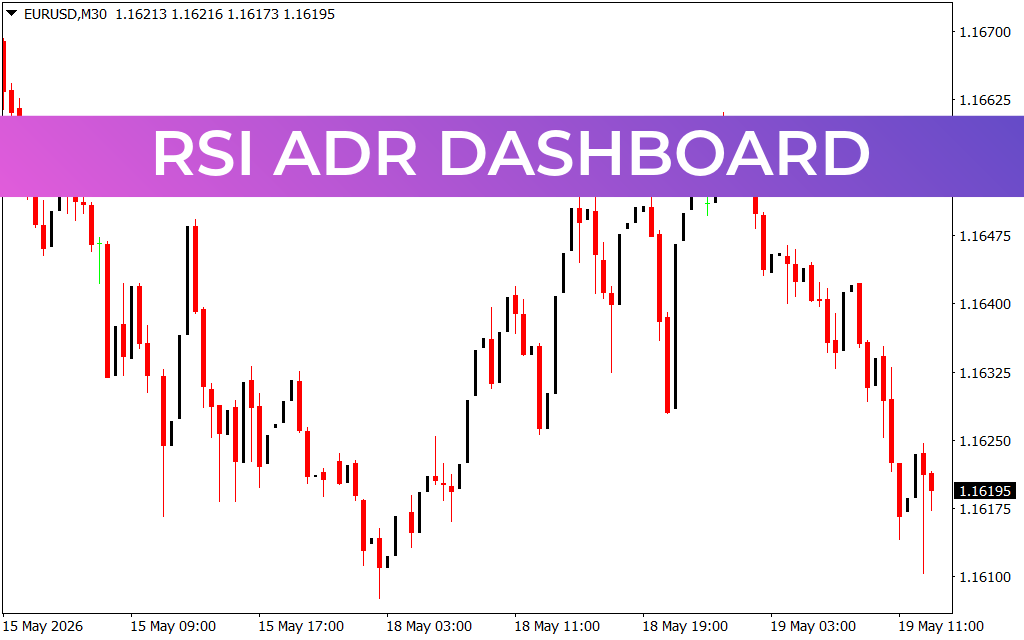
Elevate Your Market Edge with the RSI ADR Dashboard Indicator
Navigating the Forex market successfully requires a balance between understanding immediate momentum and knowing the asset's daily volatility limits. Without this structural context, intraday traders easily fall victim to entering trades just as a move is exhausted. If you trade key currency pairs like the EUR/USD, combining momentum tracking with volatility metrics is essential. The RSI ADR Dashboard indicator is a premium, multi-functional utility built to bring comprehensive, high-level data directly into a single workspace.
What is the RSI ADR Dashboard?
The RSI ADR Dashboard is an all-in-one technical system designed for modern trading platforms like MetaTrader. It seamlessly bridges two of the most critical analytical metrics in technical trading: momentum and volatility.
- Relative Strength Index (RSI): Measures the internal velocity and speed of price changes over a specified lookback period (typically 14 bars) to determine overextended conditions.
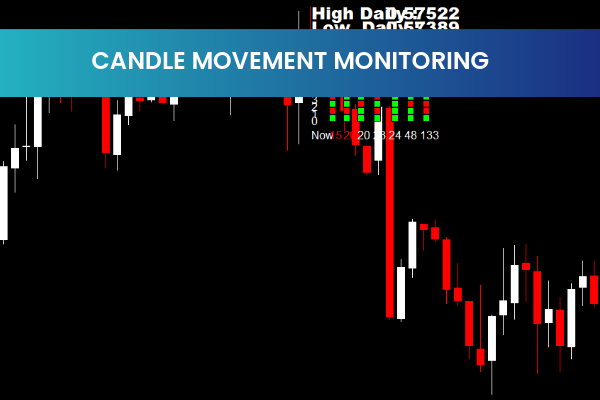
- Average Daily Range (ADR): Calculates the average pip movement of a currency pair from its absolute daily high to its absolute daily low over a designated number of days (such as 5, 10, or 20 days).
Instead of cluttering your charts with overlapping lines, windows, and sub-charts, this advanced dashboard compresses multi-timeframe RSI positions and vital ADR statistics into a clean, unified display overlay.
Structural Advantages and Trading Benefits
- Volatility Cap Awareness: By keeping a constant eye on the ADR, you instantly know how many pips an asset has moved today relative to its historical average. If a pair has fulfilled 95% of its ADR, entering a new breakout trade is statistically dangerous.
- Multi-Timeframe Momentum Sync: The dashboard panel tracks RSI values across multiple intervals—from short-term scalp charts like the 30-minute (M30) up to swing-trading timeframes. This ensures you only trade short-term setups that align with the broader market direction.
- Optimal Target Setting: ADR statistics give you clear, mathematically sound take-profit boundaries based on real market limitations rather than arbitrary pip counts.
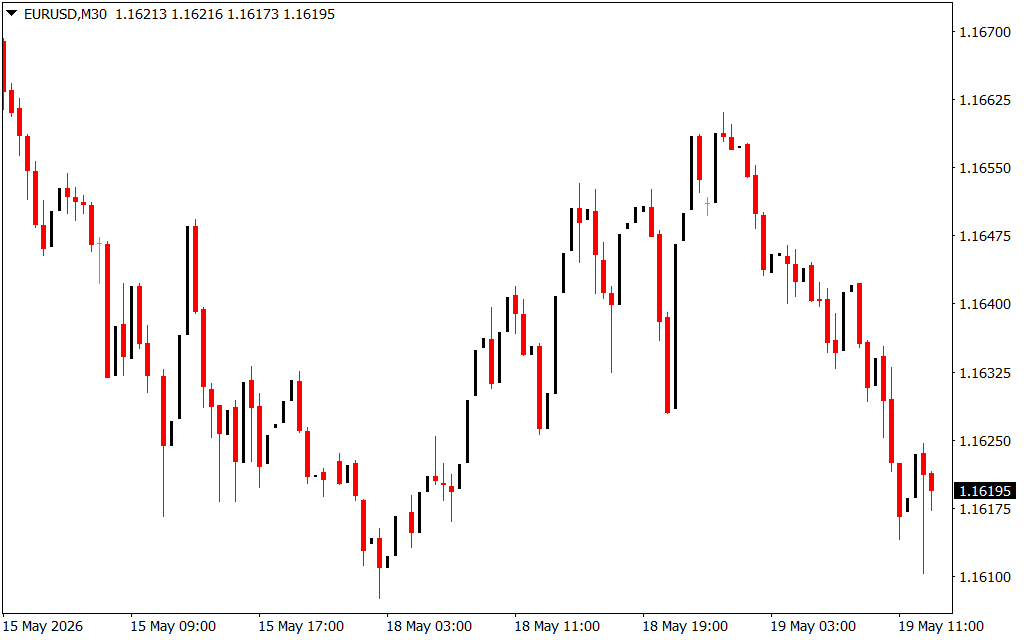
- Clutter-Free Charting: As displayed on clean candlestick interfaces, the indicator operates quietly in the background, preserving visual space so you can monitor structural support, resistance, and candlestick patterns without distraction.
How to Trade with the RSI ADR Dashboard
Maximizing the dashboard requires looking for confluence between its two core components.
When Price Action approaches a major daily resistance level on your chart, check the dashboard panel. If the RSI indicates an overbought condition across multiple timeframes, and the ADR statistic shows that the currency pair has exhausted its typical daily pip range, the probability of a downward reversal is exceptionally high. This presents a low-risk, high-reward short entry opportunity. Conversely, look for long entries when the asset is at daily support, oversold on the RSI, and at the bottom limit of its ADR.
Take control of your daily risk and precision timing by downloading the RSI ADR Dashboard indicator today.
5 Downloads
Last Update:
May 19, 2026 16:13 PM
Published:
Jan 19, 2026 19:38 PM
Category: