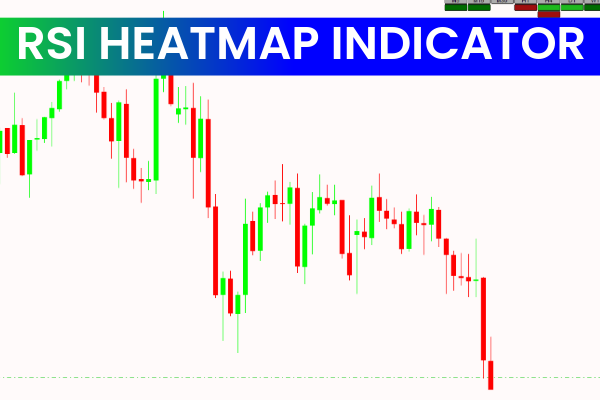
The RSI Heatmap Indicator for MT4 is a modern forex tool that allows traders to analyze multiple currency pairs simultaneously. By leveraging the Relative Strength Index (RSI), this indicator visually represents overbought and oversold conditions across the forex market. Its color-coded heat map makes it easy to see which pairs are currently strong, weak, or neutral, helping traders identify high-probability trading opportunities efficiently.
This innovative indicator is ideal for traders of all levels, from beginners who want a simple visual guide to advanced traders who need multi-pair analysis for strategy development.
How the RSI Heatmap Indicator Works
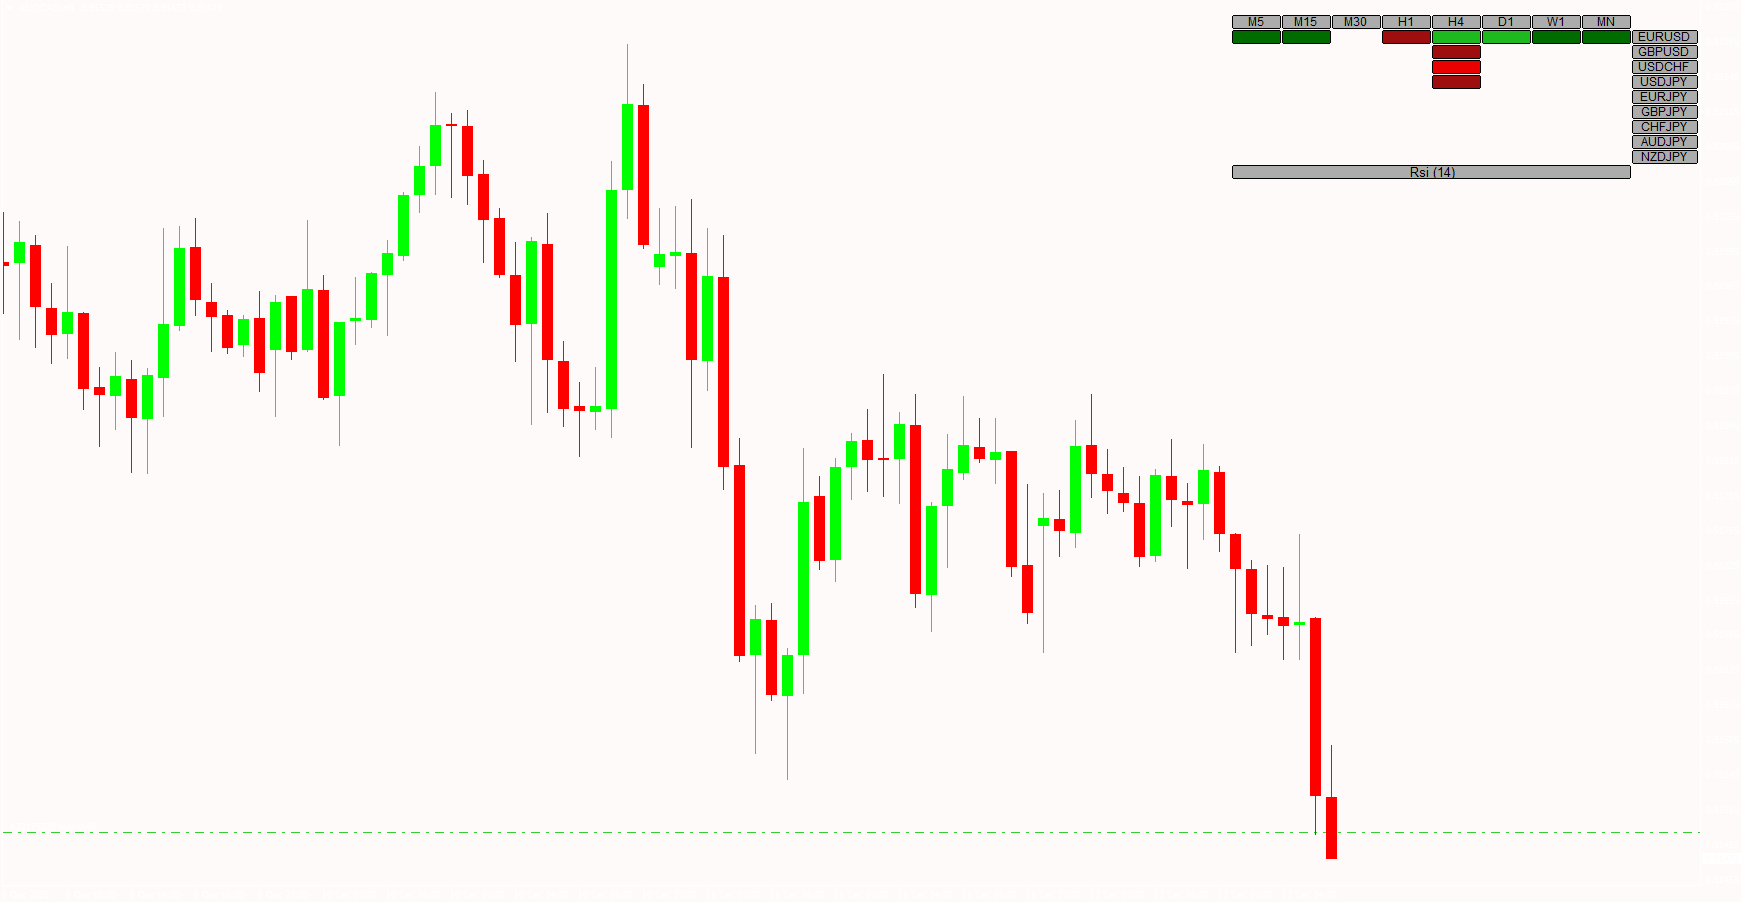
The RSI Heatmap Indicator calculates RSI values for multiple currency pairs and represents them as a heat map. Key features include:
Color-Coded Signals: Overbought pairs are highlighted in one color, while oversold pairs appear in another, allowing quick recognition of trading opportunities.
Real-Time Updates: The heat map updates continuously, giving traders the latest information about currency strength and weakness.
Multi-Pair Monitoring: Traders can track several currency pairs simultaneously, saving time compared to analyzing each pair individually.
The heat map effectively removes guesswork from pair selection, enabling traders to focus on the most profitable opportunities in the market.
Key Features of the RSI Heatmap Indicator
Multi-Pair Analysis
The indicator displays RSI values for multiple currency pairs in a single view, making it easy to compare relative strength and weakness across the forex market.
Overbought and Oversold Zones
The heat map highlights extreme RSI levels, allowing traders to identify potential reversal points where currency pairs may change direction.
Color-Coded Visuals
Different colors indicate the strength of each currency pair. This visual representation simplifies decision-making, even for traders who may struggle with numerical RSI values.
Real-Time Updates
The indicator updates in real time, ensuring that traders have accurate and up-to-date information on market conditions, which is essential for short-term and intraday strategies.
Easy to Use
The RSI Heatmap Indicator is straightforward to install and interpret, making it suitable for both beginners and professional traders.
Benefits of Using the RSI Heatmap Indicator
Simplifies Pair Selection
By visually highlighting strong and weak pairs, the indicator helps traders focus on the most promising trading opportunities, reducing analysis time.
Enhances Trading Efficiency
Traders no longer need to open multiple charts to evaluate RSI levels individually. The heat map consolidates all relevant data into one easy-to-read display.
Supports Multiple Trading Strategies
The indicator can be used for trend-following, reversal, and breakout strategies. By identifying overbought or oversold conditions, traders can align their trades with market momentum.
Reduces Emotional Decision-Making
With a clear visual representation of currency strength and weakness, traders can make objective decisions rather than reacting impulsively to market fluctuations.
Why Traders Choose the RSI Heatmap Indicator MT4
The RSI Heatmap Indicator is popular because it combines simplicity, efficiency, and accuracy. Traders can quickly spot strong and weak currency pairs, evaluate market conditions, and implement strategies without extensive chart analysis. Its real-time updates and color-coded signals make it an essential tool for forex traders seeking a competitive edge.
For more free and premium MT4 indicators to enhance your forex trading strategy, visit IndicatorForest.com and explore tools designed to improve market analysis, signal detection, and trade efficiency.
FAQ
1 Download
Published:
Dec 12, 2025 11:41 AM
Category: