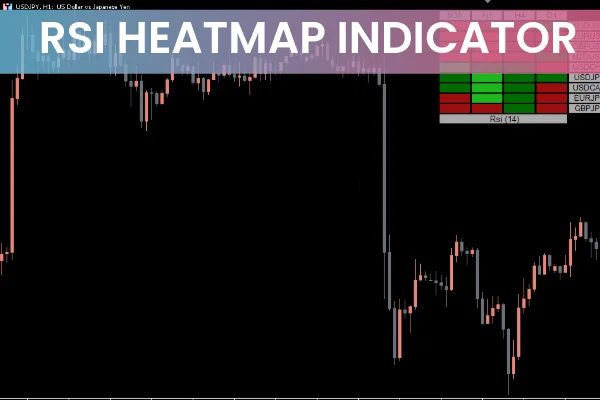
The RSI Heatmap MT5 Indicator is a powerful Forex tool that helps traders determine the strength of individual currencies. By combining the Relative Strength Index (RSI) with a multi-currency heatmap, traders can visualize currency strength across multiple timeframes, making it easier to identify potential trade setups and trend directions.
How the RSI Heatmap MT5 Indicator Works
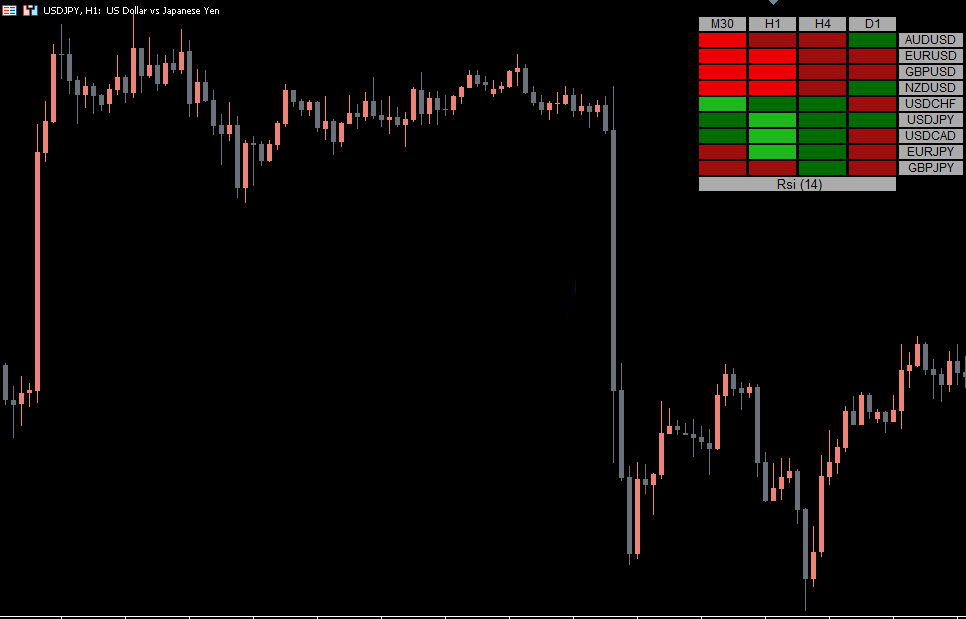
This currency strength meter uses RSI values and price direction to calculate the strength of currencies. It then plots these strengths on a heatmap using four distinct colors to represent varying levels of strength:
Strong bullish
Weak bullish
Weak bearish
Strong bearish
By monitoring these colors, traders gain an instant overview of market sentiment and the relative strength of multiple currencies in real-time.
Key Features
Multi-currency and multi-timeframe heatmap visualization
Uses RSI calculations to determine currency strength
Color-coded for easy interpretation of bullish and bearish trends
Allows traders to monitor multiple currency pairs simultaneously
Works seamlessly on MT5 platforms
How to Trade Using RSI Heatmap MT5
Buy Setup
Look for the heatmap color change from green to light green.
Confirm that the currency is strengthening over multiple timeframes.
Enter a BUY order for currency pairs involving the strengthening currency.
Manage risk using proper stop-loss levels based on Support And Resistance.
Sell Setup
Observe the heatmap color change from firebrick to red.
Confirm the weakening of the currency over multiple timeframes.
Enter a SELL order for currency pairs involving the weakening currency.
Place stop-loss levels above recent swing highs for risk management.
Tracking Currency Strength
Traders can also list all currency pairs that share a common currency (e.g., GBP) to assess its relative strength across the market. This strategy helps traders focus on strongest and weakest currencies for more reliable trade setups.
Benefits of Using RSI Heatmap MT5
Quickly identifies strong and weak currencies for trend-based trading
Monitors multiple timeframes for higher-probability setups
Works well for traders using currency strength strategies
Improves accuracy by combining RSI calculations with visual heatmap data
Free to use and compatible with MetaTrader 5
By visualizing currency strength in a heatmap, the RSI Heatmap MT5 Indicator allows traders to make faster and more informed trading decisions, improving trade timing and profitability.
Conclusion
The RSI Heatmap MT5 Indicator is an essential tool for traders focusing on currency strength strategies. By combining RSI with a color-coded heatmap, it provides a clear and accurate view of currency performance across multiple timeframes. For more MT5 indicators, trading guides, and resources, visit IndicatorForest.com today.
FAQ
3 Downloads
Published:
Nov 29, 2025 01:08 AM
Category: