The RSI MTF Indicator is a useful and popular free Forex Indicator for the MetaTrader 4 platform. It allows traders to display the Relative Strength Index (RSI) of a higher timeframe directly on a lower timeframe chart. This powerful feature helps traders analyze market momentum more accurately and avoid false signals that often occur when relying on a single timeframe.
By using the RSI MTF Indicator MT4, traders can monitor Trend Strength and momentum alignment across multiple timeframes, leading to more confident and well-informed trading decisions.
What Is the RSI MTF Indicator
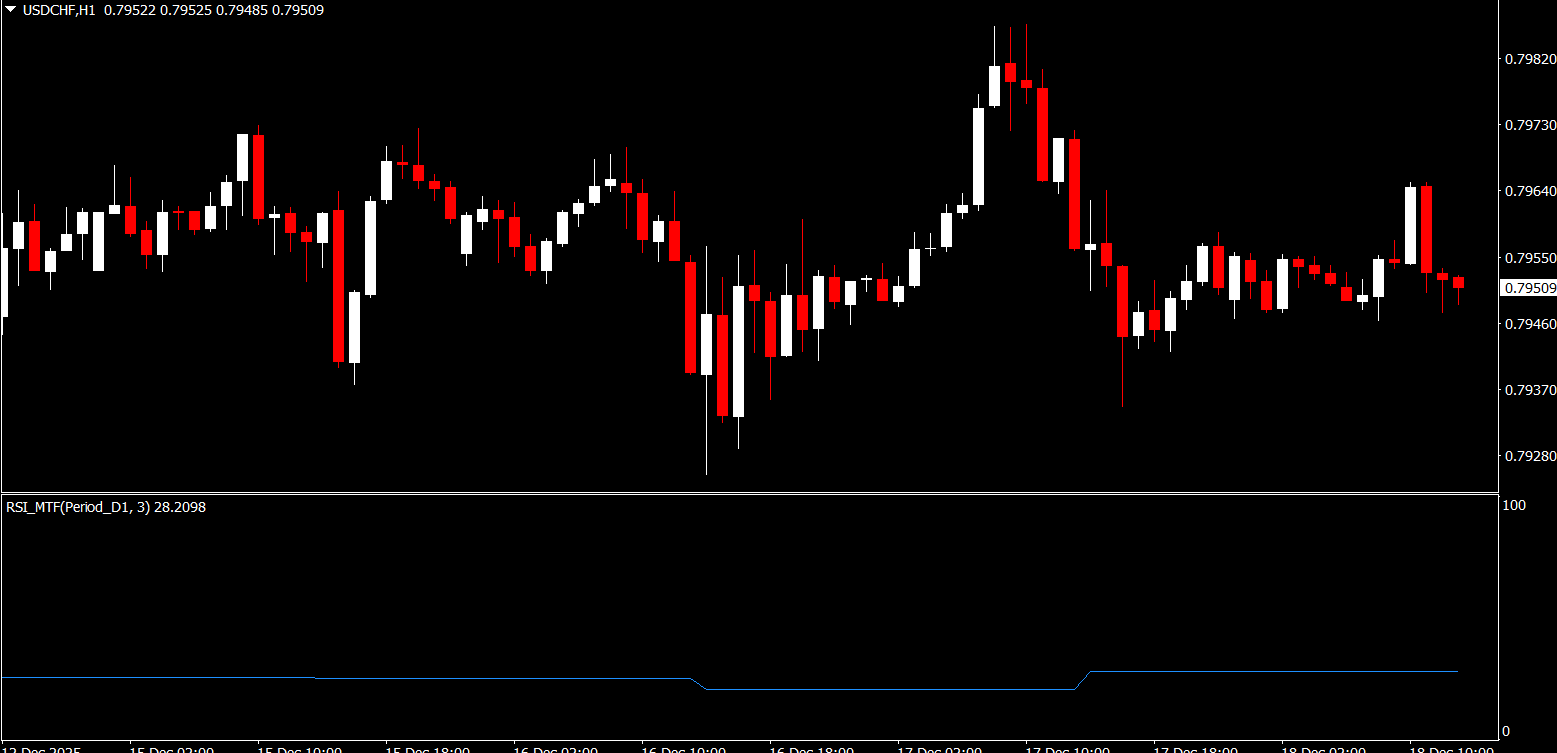
The RSI MTF Indicator is a multi timeframe Momentum Indicator based on the classic Relative Strength Index. Instead of showing RSI only for the current chart timeframe, it displays RSI values calculated from higher timeframes, such as H1, H4, or Daily, on lower charts like M5 or M15.
This approach helps traders see the bigger picture without constantly switching between charts.
How the RSI MTF Indicator Works
After attaching the indicator to an MT4 chart, it automatically calculates RSI values from the selected higher timeframe and overlays or displays them in a separate indicator window.
Key functions include:
Displaying higher timeframe RSI on lower timeframe charts
Real-time updates as price changes
Clear visual representation of RSI levels
Compatibility with all currency pairs and timeframes
This makes multi timeframe analysis faster and more efficient.
Why Multi Timeframe RSI Analysis Is Important
Multi timeframe analysis is a core concept in professional Forex trading. With the RSI MTF Indicator, traders can:
Confirm lower timeframe signals with higher timeframe momentum
Avoid trading against the dominant market trend
Identify stronger and more reliable setups
Reduce false overbought and oversold signals
For example, a buy signal on a lower timeframe is more reliable when the higher timeframe RSI confirms bullish momentum.
Identifying Overbought and Oversold Conditions
The RSI MTF Indicator helps traders clearly identify extreme market conditions across timeframes:
RSI values above 70 suggest overbought conditions
RSI values below 30 suggest oversold conditions
Alignment across timeframes strengthens signal reliability
Divergence between timeframes may warn of reversals
This makes the indicator useful for both trend-following and reversal strategies.
Using the RSI MTF Indicator for Trade Entries
Traders commonly use the RSI MTF Indicator MT4 in the following ways:
Entering trades in the direction of higher timeframe RSI
Filtering buy and sell signals from other indicators
Confirming breakout strength
Timing pullback entries within strong trends
This structured approach improves consistency and discipline in trading.
Combining RSI MTF With Other Indicators
The RSI MTF Indicator works best when combined with other technical tools such as:
Moving averages for trend direction
Support And Resistance levels
Price Action patterns
MACD or Stochastic for momentum confirmation
Using confirmation from multiple indicators increases trade accuracy and reduces risk.
Ease of Use and Customization
The RSI MTF Indicator is beginner-friendly and flexible. Traders can:
Select which higher timeframe RSI to display
Adjust RSI periods and levels
Customize colors and line styles
Apply it to any MT4 chart
These options allow traders to tailor the indicator to their personal trading style.
Advantages of the RSI MTF Indicator
Forex traders prefer this indicator because it:
Provides clear multi timeframe momentum insight
Improves trend confirmation
Reduces false signals
Saves time switching between charts
Is free and fully compatible with MT4
Its simplicity combined with analytical depth makes it a valuable trading tool.
Who Should Use the RSI MTF Indicator
This indicator is ideal for:
Scalpers who need higher timeframe confirmation
Day traders seeking trend alignment
Swing traders analyzing momentum shifts
Beginner traders learning multi timeframe analysis
It adapts well to different trading styles and experience levels.
Conclusion and Call to Action
The RSI MTF Indicator MT4 is a free and powerful Forex tool that displays higher timeframe RSI values on lower charts. By enabling efficient multi timeframe analysis, it helps traders confirm trends, improve entries, and make smarter trading decisions.
To download this indicator and explore more free MT4 Forex indicators, tools, and expert guides, visit IndicatorForest.com and strengthen your trading strategy today.
FAQ
RSI MTF displays higher timeframe RSI values directly on lower timeframe charts, allowing you to see the bigger picture without switching between charts. This helps confirm lower timeframe signals with higher timeframe momentum and reduces false signals.
By comparing RSI across timeframes, you can confirm lower timeframe signals with higher timeframe momentum, avoid trading against the dominant trend, and identify stronger setups. For example, a buy signal on M15 is more reliable when H1 RSI confirms bullish momentum.
RSI values above 70 typically suggest overbought conditions where sell opportunities may arise, while values below 30 suggest oversold conditions where buy opportunities may appear. Alignment across multiple timeframes strengthens signal reliability.
You can display any higher timeframe RSI on your current chart. Common combinations include H1 RSI on M15 charts, H4 RSI on H1 charts, or Daily RSI on H4 charts. Choose timeframes that match your trading style.
RSI MTF works best when combined with moving averages for trend direction, support and resistance levels for entry timing, price action patterns, and MACD or Stochastic for momentum confirmation. Multiple confirmations improve trade accuracy.
1 Download
Published:
Dec 18, 2025 07:18 AM
Category: