The RSI on MA MT4 Indicator is a powerful tool that combines the Relative Strength Index (RSI) with moving averages to identify potential trend reversals in the forex market. By calculating the RSI of two moving averages with different periods, this indicator generates bullish and bearish signals whenever the RSI lines cross, providing smoother and more reliable Trend Reversal indications compared to traditional moving average crossovers.
How the RSI on MA MT4 Indicator Works
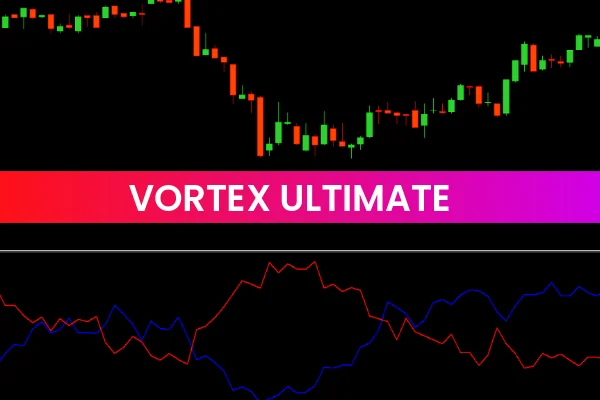
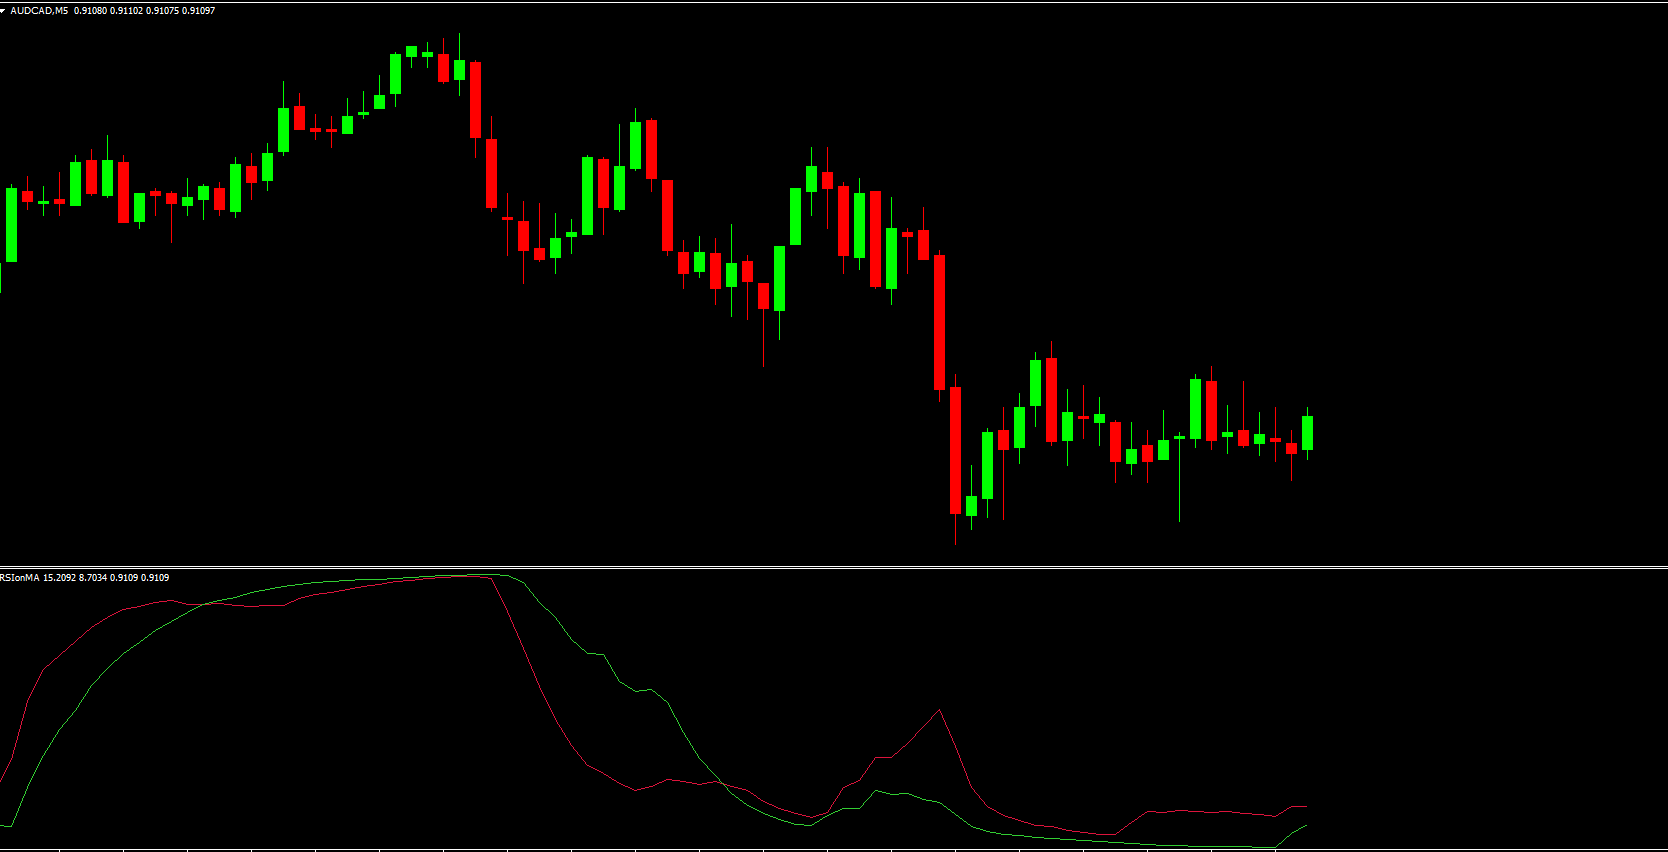
The indicator plots two lines in a separate window:
Red Line: RSI of the faster moving average.
Green Line: RSI of the slower moving average.
A bullish trend reversal is signaled when the red line crosses above the green line. Conversely, a bearish trend reversal is indicated when the red line crosses below the green line. These crossovers offer clear entry signals for traders to take advantage of changing market trends.
Additionally, the oscillator ranges from 0 to 100, allowing traders to add overbought (80) and oversold (20) levels. This feature helps filter trades: entering buy positions in oversold conditions and sell positions in overbought conditions provides higher probability trades.
Benefits of Using the RSI on MA MT4 Indicator
Smoother Signals: RSI applied on moving averages reduces false signals and provides more reliable trend reversals.
Versatile: Works on all timeframes, suitable for intraday, swing, and long-term trading.
User-Friendly: Ideal for both beginner and advanced traders.
Overbought/Oversold Filtering: Helps traders enter trades only in favorable conditions.
Technical Analysis Support: Complements other indicators and trading strategies effectively.
The RSI on MA MT4 Indicator is an excellent tool for traders looking to enhance their trend detection and reversal strategies. By combining RSI with moving averages, it provides smoother, more accurate signals and helps traders make confident trading decisions.
Boost your trading strategy with the RSI on MA MT4 Indicator. Visit IndicatorForest.com to download this free MT4 tool and start identifying trend reversals effectively.
FAQ
RSI On MA calculates the RSI of two moving averages with different periods instead of price directly. This generates smoother and more reliable trend reversal indications compared to traditional moving average crossovers, providing clearer signals when the RSI lines cross.
The red line represents the RSI of the faster moving average, while the green line represents the RSI of the slower moving average. A bullish trend reversal is signaled when the red line crosses above the green line, and a bearish reversal when the red line crosses below the green line.
The oscillator ranges from 0 to 100, allowing traders to add overbought (80) and oversold (20) levels. This feature helps filter trades: entering buy positions in oversold conditions and sell positions in overbought conditions provides higher probability trades.
It works on all timeframes, making it suitable for intraday, swing, and long-term trading. The indicator is user-friendly and ideal for both beginner and advanced traders, providing smoother signals that reduce false signals compared to traditional RSI.
Combine it with other indicators and trading strategies effectively. The smoother signals from RSI applied on moving averages complement technical analysis and help traders make confident trading decisions by providing more reliable trend reversals.
Published:
Dec 17, 2025 12:34 PM
Category: