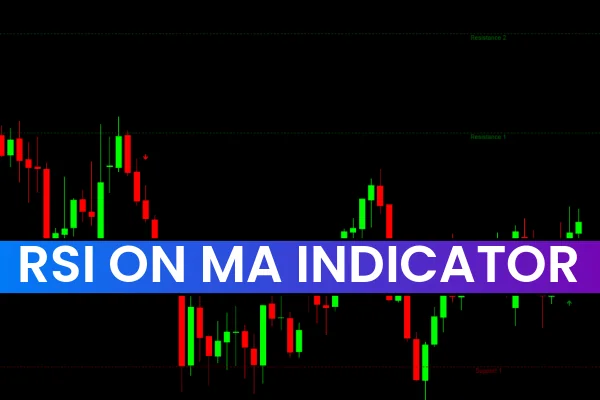
The RSI on MA Crossover Indicator is a powerful technical tool that combines the Moving Average (MA) crossover method with the Relative Strength Index (RSI). This dual approach allows traders to monitor both trend direction and market momentum, giving more accurate buy and sell signals. Unlike traditional moving average indicators, the RSI on MA crossover provides insights into the strength of the trend, helping traders to avoid false signals and trade more confidently.
This indicator works effectively on all currency pairs, metals, commodities, and stocks. It is versatile enough to identify both short-term and long-term trends, making it suitable for scalpers, intraday traders, and swing traders alike. Moreover, it can be applied on any timeframe, from 1-minute charts to daily or weekly charts, depending on your trading strategy.
How the RSI on MA Crossover Indicator Works
The indicator draws two lines representing different moving averages:
Crimson RSI Line: Represents a faster-moving average and reacts quickly to price changes.
Lime Green Line: Represents a slower-moving average and reflects the overall trend direction.
Buy and sell signals appear when these two lines cross, indicating potential entry points and momentum shifts.
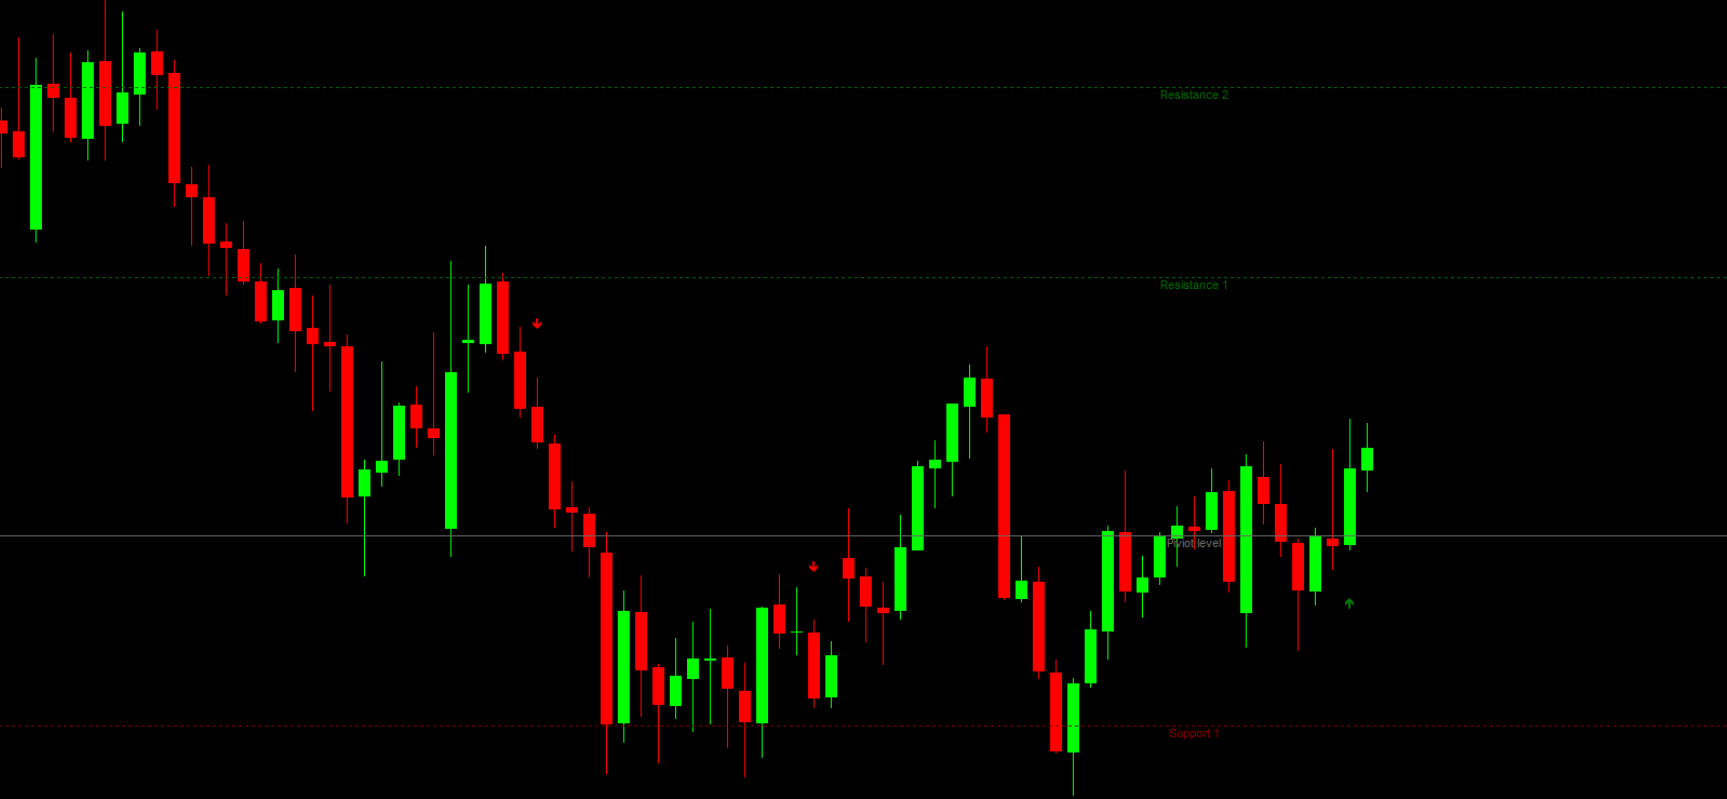
Trading Signals with RSI on MA Crossover
Buy Signal
A buy signal occurs when the crimson line crosses above the lime green line.
This indicates rising momentum and a bullish trend.
Place a stop loss below the entry candle or the previous swing low.
Consider exiting the trade when the lines cross again or at the next resistance level.
Sell Signal
A sell signal occurs when the crimson line crosses below the lime green line.
This signals declining momentum and a bearish trend.
Place a stop loss above the entry candle or the swing high.
Exit the trade when the crimson line crosses above the green line or at the next support level.
Trading Example
For example, on the EUR/USD 1-hour chart, the crimson line crossed below the lime green line, indicating a bearish signal. The market moved over 100 pips following this signal. Traders exited the position when either the next crossover occurred or the price reached the next support level.
Similarly, when the crimson line crossed above the lime green line, the indicator generated a buy signal. The market moved over 70 pips, confirming the bullish momentum. This demonstrates the effectiveness of the RSI on MA crossover in capturing trending moves while filtering out noise.
Advantages of the RSI on MA Crossover Indicator
Combines trend-following and momentum detection in one indicator.
Works across all currency pairs, commodities, metals, and stocks.
Suitable for multiple timeframes, from intraday to long-term trading.
Provides clear buy/sell signals based on line crossovers.
Can be combined with other technical tools like support/resistance, RSI, or MACD for improved accuracy.
By using the RSI on MA crossover, traders can identify optimal entry and exit points while minimizing risk.
Conclusion
The RSI on MA Crossover Indicator is a versatile trading tool for identifying market trends and momentum shifts. By simply following the line crossovers, traders can capture both bullish and bearish moves effectively. While it can be used as a standalone indicator, combining it with other technical strategies ensures higher accuracy and better trading outcomes. Download the indicator today at IndicatorForest.com and enhance your trading strategy.
FAQ
The RSI on MA Crossover Indicator combines the Moving Average (MA) crossover method with the Relative Strength Index (RSI). This dual approach allows traders to monitor both trend direction and market momentum, giving more accurate buy and sell signals than using either indicator alone.
The indicator generates buy signals when moving averages cross in a bullish direction and RSI confirms momentum strength. Sell signals occur when moving averages cross bearishly and RSI confirms selling pressure. This combination helps filter false signals and improves trade accuracy.
By combining trend direction (MA) with momentum strength (RSI), the indicator provides more reliable signals than using either tool separately. It helps traders identify not just trend direction but also the strength of the trend, reducing false signals during weak or ranging markets.
Enter trades when both the MA crossover and RSI alignment confirm the same direction. Wait for both components to agree before entering trades, and use the combination to filter out weak signals. Always combine with support/resistance levels or price action patterns for additional confirmation.
The indicator works on all MT4 timeframes and currency pairs. It is suitable for scalping, day trading, and swing trading, though many traders find it most effective on H1 and H4 charts where both trend and momentum signals are clearer and more reliable.
1 Download
Published:
Dec 14, 2025 00:30 AM
Category: