The RSI Overbought Oversold Indicator is a powerful and widely used Forex oscillator designed for the MetaTrader 4 (MT4) platform. This indicator helps traders detect overbought and oversold market conditions and highlights potential Trend Reversal opportunities using clear BUY and SELL arrows. Because of its simplicity and effectiveness, the RSI Overbought Oversold Indicator is popular among both beginner and experienced Forex traders.
By analyzing price momentum through the Relative Strength Index (RSI), this indicator allows traders to anticipate possible bullish or bearish moves before they fully develop. When combined with Price Action or trend analysis tools, it becomes a reliable component of a complete trading strategy.
What Is the RSI Overbought Oversold Indicator?
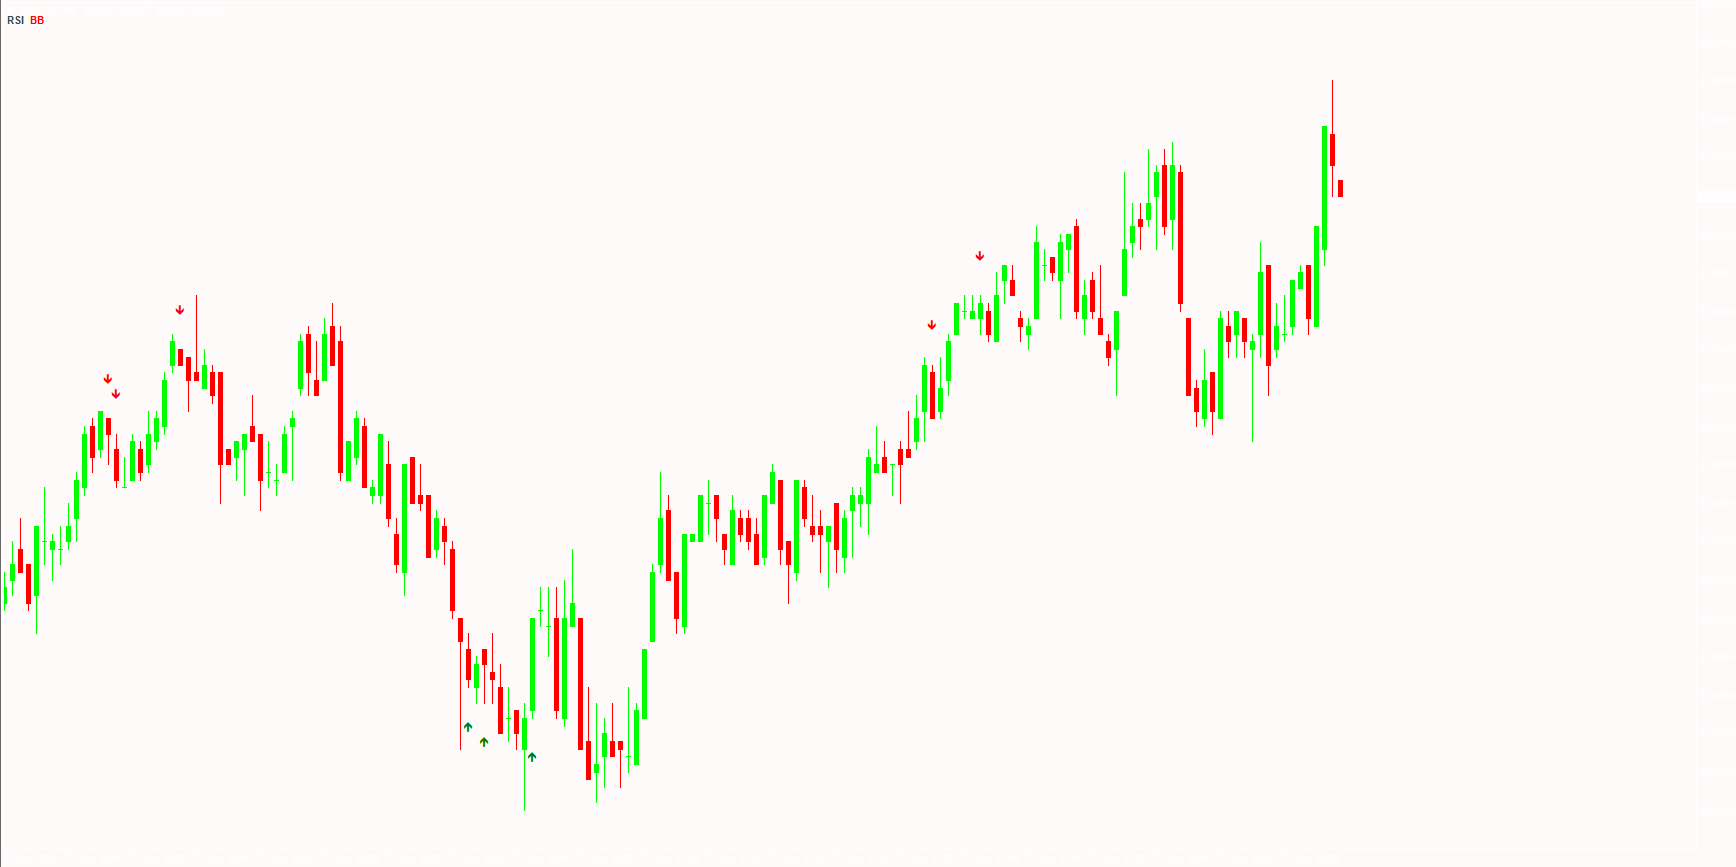
The RSI Overbought Oversold Indicator is based on the Relative Strength Index, a momentum oscillator that measures price strength on a scale from 0 to 100. Instead of displaying the RSI line directly, this indicator simplifies analysis by plotting visual signal arrows on the price chart.
A RED arrow appears when RSI reaches overbought conditions, signaling a potential SELL opportunity
A GREEN arrow appears when RSI reaches oversold conditions, signaling a potential BUY opportunity
These arrows allow traders to react quickly to potential reversals without needing to interpret raw RSI values.
How the RSI Overbought Oversold Indicator Works
The indicator continuously monitors RSI levels in the background:
Overbought Conditions
When RSI rises above the 70 level, the market is considered overbought. At this point, the indicator plots a RED arrow, suggesting that bullish momentum may be exhausted and a bearish reversal could occur.
Oversold Conditions
When RSI falls below the 30 level, the market is considered oversold. The indicator then plots a GREEN arrow, indicating that selling pressure may be weakening and a bullish move could be imminent.
By focusing only on key RSI zones, the RSI Overbought Oversold Indicator filters out unnecessary noise and highlights high-probability reversal zones.
Key Features of the RSI Overbought Oversold Indicator
Arrow-Based Signals
Displays BUY and SELL arrows directly on the chart for quick decision-making.
RSI-Based Logic
Uses proven RSI overbought and oversold levels for reliable signal generation.
Chart-Friendly Design
Does not clutter the chart, making it easy to use alongside other indicators.
Works on Any Timeframe
Effective for Scalping, day trading, swing trading, and long-term strategies.
Beginner-Friendly
No advanced technical knowledge required to interpret signals.
Benefits of Using the RSI Overbought Oversold Indicator
Clear Trade Entries and Exits
The indicator provides straightforward BUY and SELL arrows that help traders identify optimal entry and exit zones.
Early Trend Reversal Detection
By signaling overbought and oversold conditions, traders can anticipate reversals before major price movements occur.
Improves Trade Timing
The indicator helps traders avoid entering trades too late when momentum is already exhausted.
Strong Confirmation Tool
When used together with trendlines, Support And Resistance, or moving averages, the RSI Overbought Oversold Indicator improves trade accuracy.
How to Trade with the RSI Overbought Oversold Indicator
Buy Setup
Wait for a GREEN arrow to appear
Confirm bullish structure using price action or trend tools
Enter buy trade near support
Place stop-loss below recent swing low
Sell Setup
Wait for a RED arrow to appear
Confirm bearish bias with resistance or trend analysis
Enter sell trade near resistance
Place stop-loss above recent swing high
To reduce false signals, traders should avoid using the indicator alone in strong trending markets without confirmation.
Who Should Use This Indicator?
The RSI Overbought Oversold Indicator is ideal for:
Reversal traders
Scalpers targeting short-term pullbacks
Swing traders seeking market turning points
Forex beginners learning momentum-based trading
Why the RSI Overbought Oversold Indicator Is Effective
This indicator stands out because it converts complex RSI data into simple visual signals. It removes guesswork, saves time, and helps traders focus on high-probability setups. Its flexibility and ease of use make it one of the best overbought oversold indicators for MT4.
Call to Action
If you’re looking for reliable and free Forex indicators to enhance your trading performance, visit IndicatorForest.com. Explore a wide range of MT4 tools designed to help you trade smarter and more confidently.
FAQ
Published:
Dec 22, 2025 02:29 AM
Category: