The RSI TS Indicator is a popular and reliable Forex indicator designed for the MetaTrader 4 platform. It is a free trading tool that uses the Relative Strength Index to identify market trends, Trend Strength, and potential trading opportunities. Due to its simplicity and effectiveness, the RSI TS Indicator is widely used by both beginner and experienced Forex traders.
This indicator combines classic RSI analysis with trend detection, making it easier for traders to understand market conditions and react to price movements with confidence. The RSI TS Indicator is especially useful when used alongside other technical indicators such as moving averages and oscillators.
How the RSI TS Indicator Works
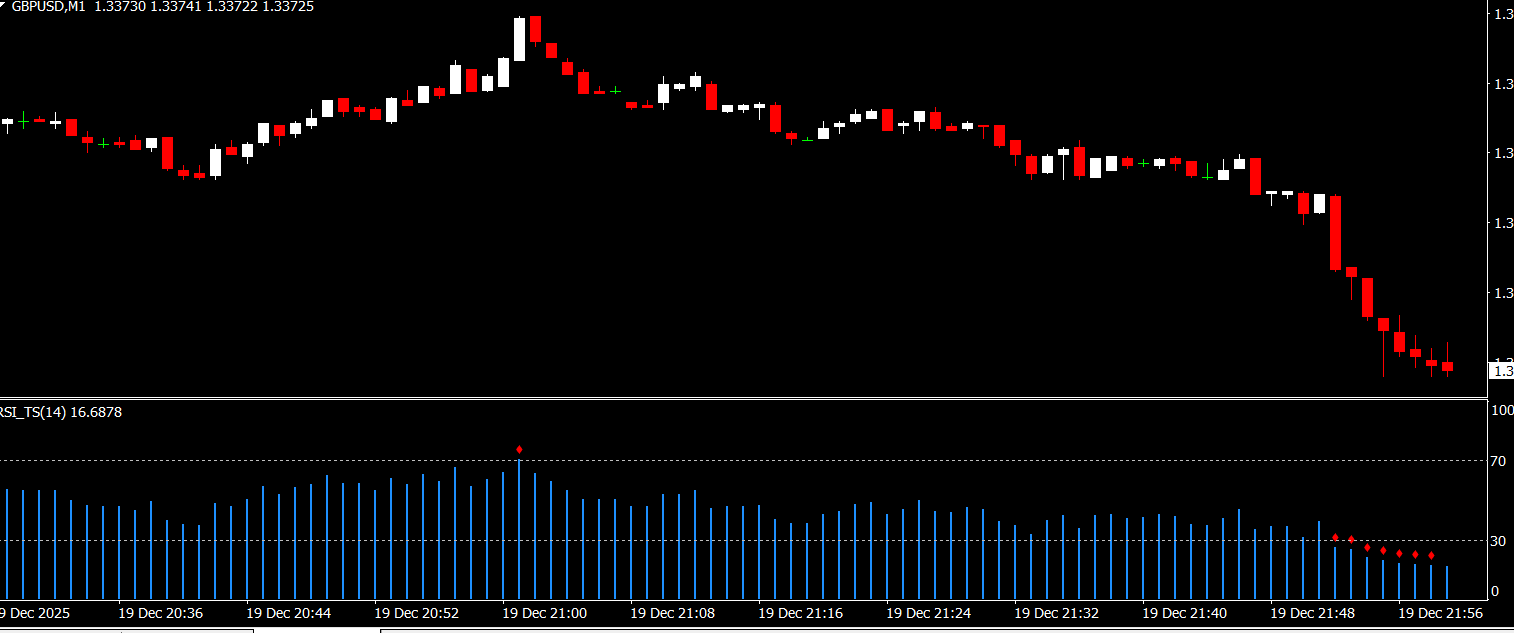
The RSI TS Indicator is built around two main components displayed directly on the chart. The first is the RSI line, which is calculated using the closing prices of the last 14 periods. The second is the trend line, which is derived from the RSI values and reflects the strength and direction of the trend.
When the RSI line moves upward and remains strong, it suggests bullish market conditions. When the RSI line declines, it indicates bearish pressure. The trend line helps confirm whether the current movement has enough strength to continue or whether a potential reversal may occur.
The RSI TS Indicator also highlights overbought and oversold conditions. When the RSI line rises above the 70 level, it signals that the market may be overbought and due for a correction. When the RSI line falls below the 30 level, it suggests oversold conditions and a possible price bounce.
Key Features and Benefits
Uses RSI to determine market trend direction
Displays trend strength using a dedicated trend line
Identifies overbought and oversold market conditions
Helps spot potential entry and exit points
Can be used to identify Support And Resistance levels
Works well with moving averages and oscillators
Easy to read and interpret signal
Free to download and use on MT4
Using the RSI TS Indicator in Trading
Traders can apply the RSI TS Indicator to any Forex chart and timeframe, making it suitable for Scalping, day trading, and swing trading strategies. When the RSI line is above 50 and the trend line is strong, traders may look for buying opportunities. When the RSI line is below 50 and the trend line weakens, selling opportunities may appear.
The RSI TS Indicator is often used as a confirmation tool. For example, traders may wait for Price Action signals or moving average crossovers and then use the RSI TS Indicator to confirm trend strength before entering a trade. This approach helps reduce false signals and improves overall trading accuracy.
Support and resistance levels can also be identified by observing how the RSI reacts near key price zones. Divergences between price and RSI may indicate potential trend reversals, offering early warning signals for traders.
Why Traders Use the RSI TS Indicator
The RSI TS Indicator is valued for its balance between simplicity and functionality. It provides essential market insights without overwhelming traders with complex calculations. Its ability to identify trend direction, momentum, and extreme market conditions makes it a versatile tool for many trading strategies.
Because it is free and easy to customize, the RSI TS Indicator is an excellent addition to any MT4 trading setup. It helps traders improve timing, manage risk, and make more informed trading decisions.
To download the RSI TS Indicator and explore more professional Forex indicators, visit IndicatorForest.com and strengthen your MT4 trading strategy today
FAQ
3 Downloads
Published:
Dec 21, 2025 07:12 AM
Category: