Master Market Momentum with the RSIOMA V3 CD Var Indicator for MT4
In the pursuit of trading excellence, the ability to separate market noise from genuine Trend Strength is the ultimate advantage. While the standard Relative Strength Index (RSI) is a staple for many, professional traders often require a more refined tool that combines momentum with the smoothing properties of moving averages. The RSIOMA V3 CD Var indicator for MetaTrader 4 (MT4) is a sophisticated technical utility that does exactly that—offering a highly responsive oscillator that identifies trend pivots and momentum shifts with surgical precision.
The Logic Behind RSIOMA V3
The name RSIOMA stands for "RSI of Moving Average." Unlike a traditional RSI, which calculates relative strength based on raw price data, this indicator applies the RSI formula to a pre-smoothed moving average. This dual-layered approach significantly reduces the "choppiness" often associated with standard oscillators, providing a much cleaner signal line that is easier to interpret during volatile market conditions.
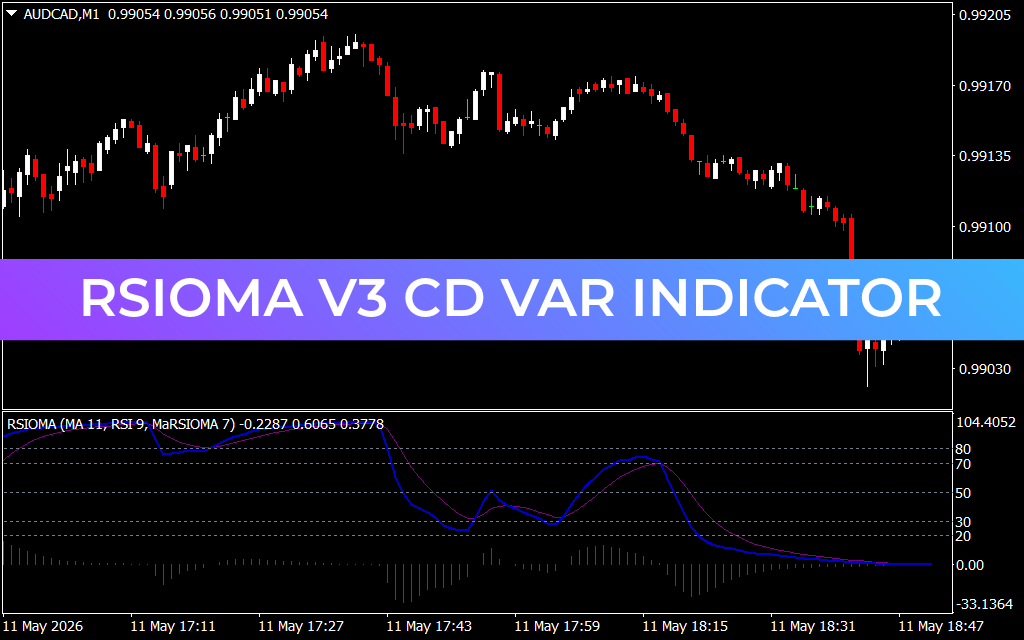
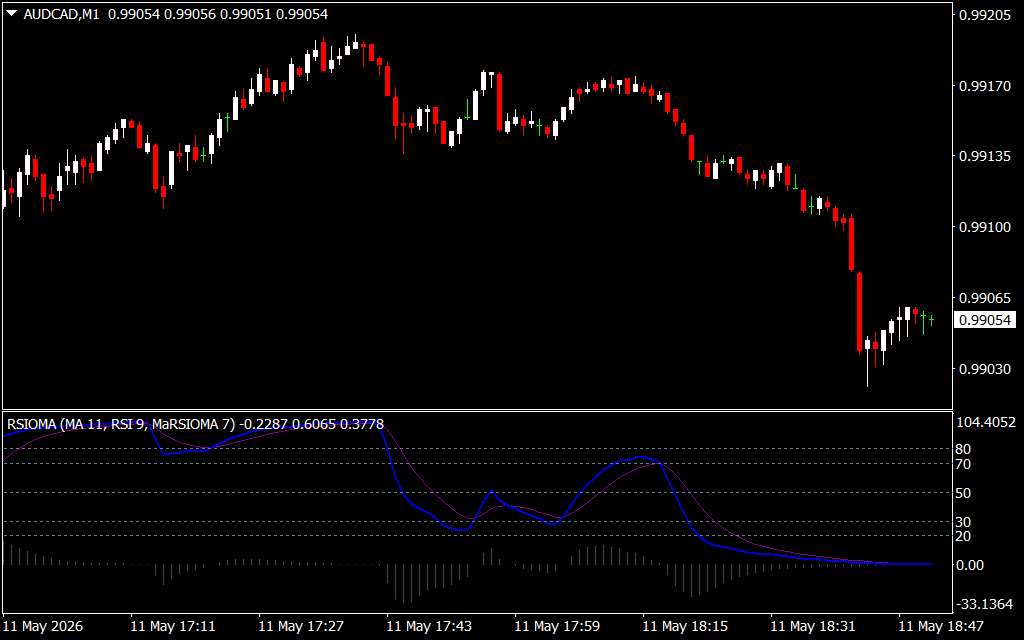
As seen in the AUD/CAD M1 chart, the indicator appears in a sub-window featuring several critical components:
- The Signal Line (Blue): This represents the smoothed momentum of the market. Its position relative to the center levels determines the current trend bias.
- The Trigger Line (Purple): A secondary moving average used to generate crossover signals.
- Dynamic Levels (20, 30, 50, 70, 80): These classic boundaries help identify oversold and overbought conditions, as well as the "bull/bear" threshold at the 50 level.
- Momentum Histogram: The vertical bars at the zero line provide visual confirmation of momentum acceleration or deceleration.
Strategic Trading Signals
The RSIOMA V3 CD Var is a versatile powerhouse capable of providing multiple types of high-probability signals:
- Trend Crossovers: A bullish signal is generated when the blue RSIOMA line crosses above the purple trigger line, especially when rising from the oversold region (below 30). Conversely, a bearish signal occurs when the blue line crosses below the purple line from the overbought region (above 70).
- The 50-Level Pivot: The center 50 level acts as a critical barometer for trend direction. When the indicator stays consistently above 50, it confirms a strong bullish regime. A sustained move below 50 indicates bearish dominance.
- Divergence Detection: This is perhaps the most powerful use of the RSIOMA. If the price makes a new high but the blue signal line makes a lower high, it reveals a "hidden" loss of momentum, often preceding a sharp market reversal.
- Extreme Exhaustion: Readings above 80 or below 20 warn of climactic Price Action. As shown in the AUD/CAD example, when the indicator reaches these extremes, the market is highly prone to a mean-reversion move back toward the midline.
Why Professional Traders Choose RSIOMA V3
The primary benefit of the CD Var (Change Deviation Variance) version is its adaptive nature. It is designed to minimize lag without sacrificing the smoothness of the signal. Whether you are a scalper looking for quick momentum bursts on the M1 chart or a swing trader identifying major trend shifts on the Daily timeframe, this indicator provides the structural clarity needed for disciplined execution.
By integrating the RSIOMA V3 CD Var into your trading system, you transition from reacting to price spikes to trading the underlying mathematical momentum. It is an elite tool for those who demand precision, clarity, and a deeper understanding of market dynamics.
1 Download
Last Update:
May 11, 2026 21:53 PM
Published:
Jan 24, 2026 13:11 PM
Category: