Smooth Out Market Noise: RSTL Line Indicator for MT4
Navigating lower timeframes like the 5-minute (M5) chart requires an exceptional ability to differentiate between sustainable structural trends and chaotic intraday noise. For scalpers and day traders, relying on standard lagging moving averages frequently leads to late entries or getting chopped up in range-bound distributions. The RSTL Line Indicator (Reference Smart Trend Line) addresses this fundamental issue by employing digital filtering algorithms to provide a smoothed, responsive trend line directly inside your MetaTrader 4 terminal.
Understanding the Mathematics of the RSTL Filter
Unlike traditional simple or exponential moving averages, which merely average past closing prices and introduce significant execution lag, the RSTL line uses advanced digital signal processing (DSP) concepts. It acts as a low-pass filter, mathematically isolating the low-frequency market cycles (the true trend) while stripping away the high-frequency market noise that leads to false breakouts.
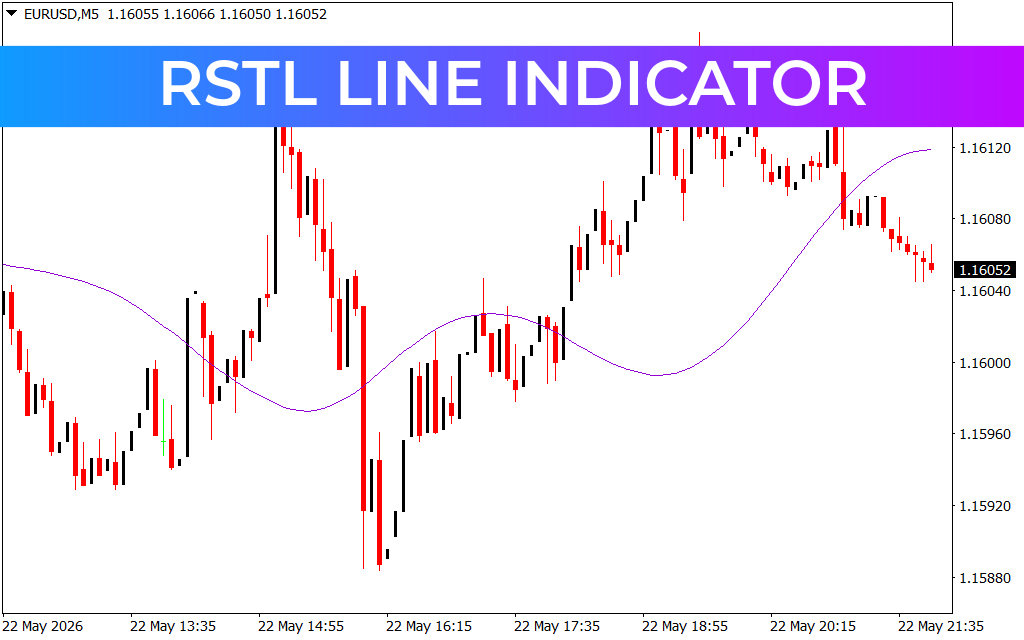
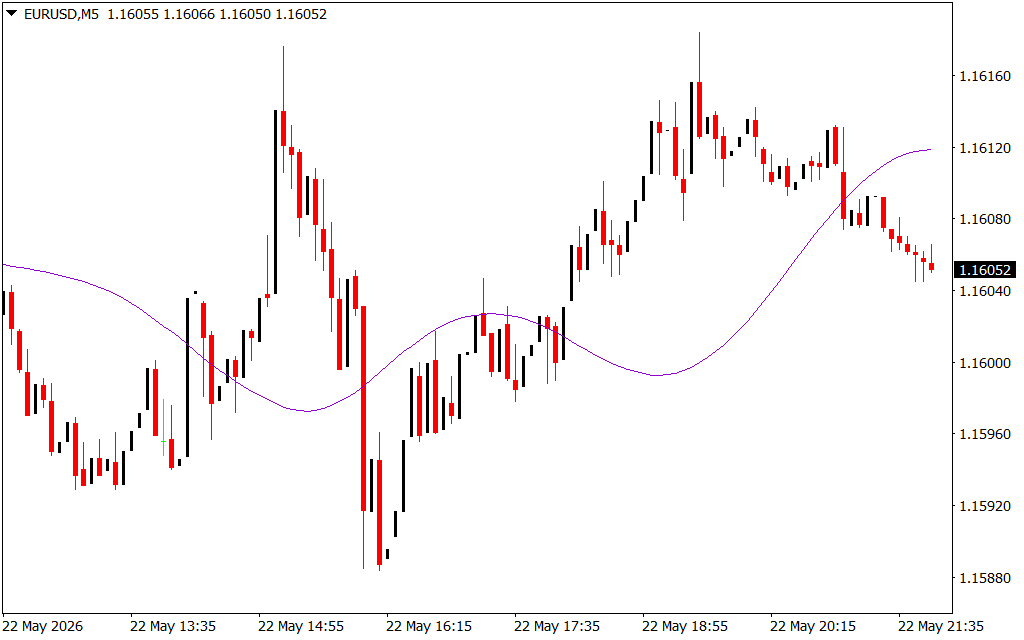
When analyzing its visual overlay on an M5 EUR/USD workspace, its technical superiority becomes clear:
- Algorithmic Wave Tracking: The indicator plots a continuous, elegant violet line that cuts directly through the heart of Price Action. Its unique curvature adapts rapidly to genuine structural pivots without turning jagged.
- Dynamic Support And Resistance: Rather than remaining rigid, the line flexes dynamically. During a robust expansion, it behaves as a trailing support floor; during a structural breakdown, it hardens into an overhead supply ceiling.
This digital smoothing empowers systematic traders to identify the true direction of institutional order flow without the latency associated with older technical tools.
Strategic Execution on the EUR/USD M5 Chart
In high-volume day trading sessions, pairs like the EUR/USD fluctuate rapidly between expansion legs and corrective cycles. On the M5 chart, a steep, algorithmic sell-off can push prices far below the violet reference line.
Systematic market participants can utilize the RSTL's positioning to execute two core tactical models:
- Trend Phase Identification: When the price scales above the RSTL line and the line slopes steadily upward, a bullish phase is confirmed. Traders should exclusively hunt for long entries. Conversely, when price slips below a downward-sloping line, a bearish delivery phase is active.
- Mean-Reversion and Pullback Entries: In a confirmed bearish trend, price will occasionally print counter-trend micro-rallies back up to the line. When price tests the RSTL line from below and shows candlestick rejection, it provides a high-probability trigger to enter short positions aligned with the master cycle.
By establishing strict rules anchored to this digital filter, you stop chasing volatile candle spikes and start executing at mathematically validated value zones.
Core Features for Modern Intraday Traders
- Digital Signal Processing (DSP) Engine: Engineered to minimize calculation lag, allowing you to catch micro-trend shifts ahead of standard moving averages.
- Visual Chart Clarity: Replaces messy multi-line indicator combinations with a single, highly accurate trend anchor that leaves your candlestick workspace clean.
- Universal Confluence Compatibility: Integrates seamlessly into advanced trading methodologies, acting as an exceptional directional filter alongside order blocks, volume profile, or pivot points.
The RSTL Line Indicator functions as an analytical shield against market manipulation, transforming erratic sub-
2 Downloads
Last Update:
May 23, 2026 01:47 AM
Published:
Jan 17, 2026 12:19 PM
Category: