The RSX indicator is an enhanced version of the well-known Relative Strength Index (RSI). It detects market dynamics and price fluctuations by transforming accumulated market data to produce smoother, more reliable signals. Unlike traditional RSI, the RSX reduces market noise, minimizing fake signals and improving overall accuracy. One key advantage is that it can be smoothed without lag, making it highly responsive in active markets.
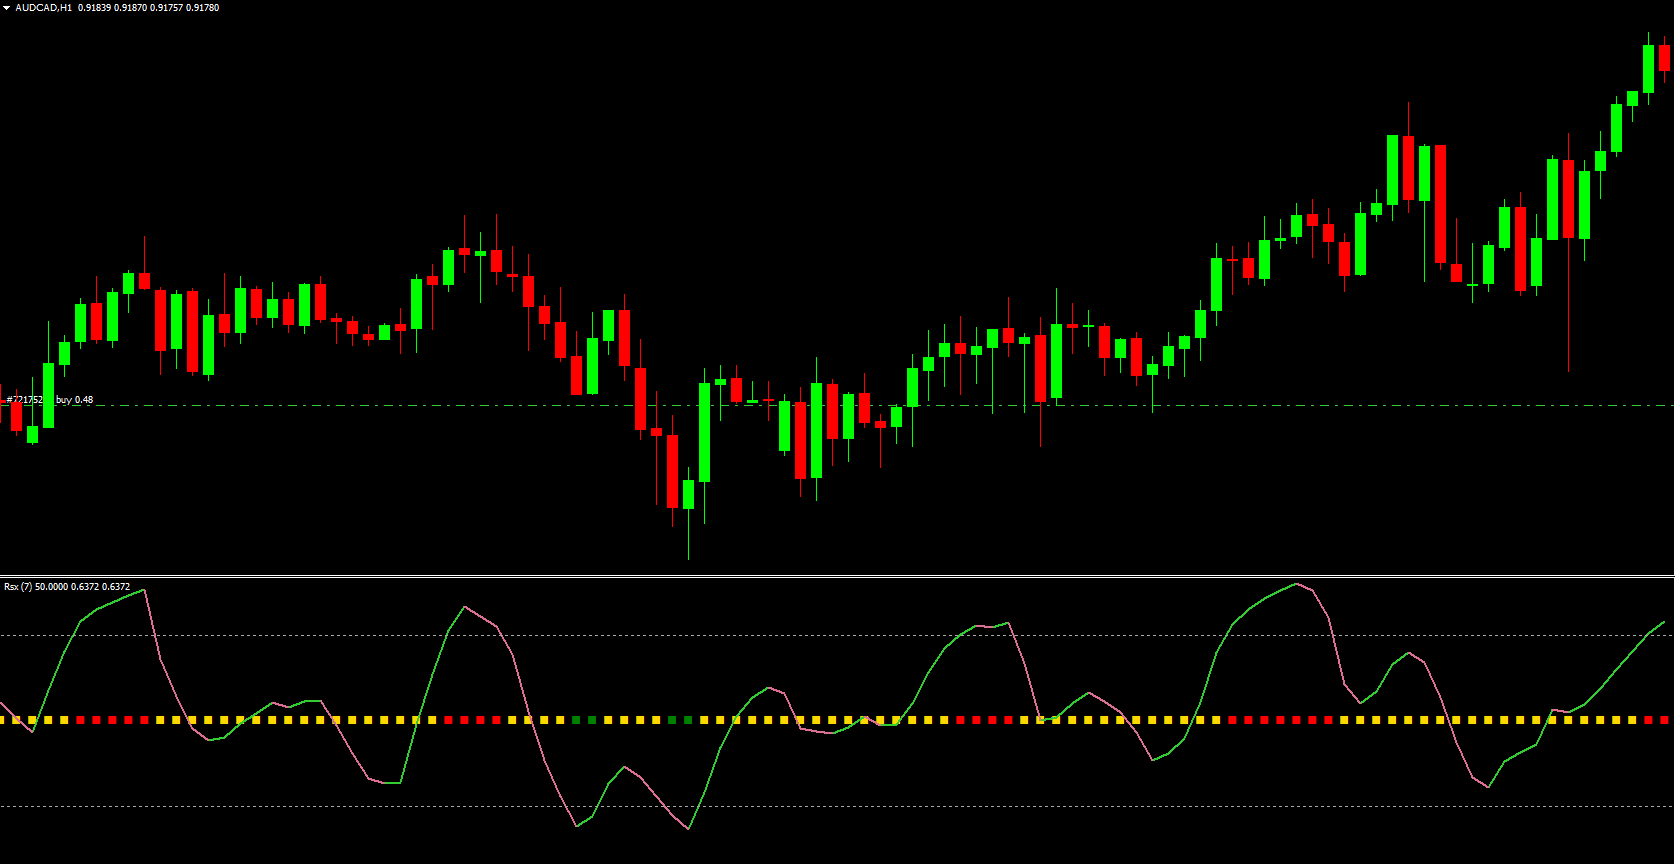
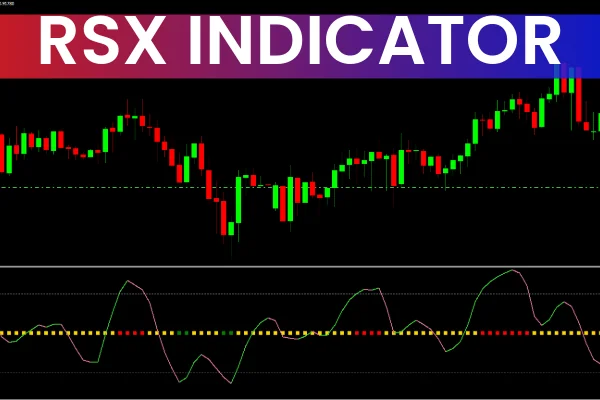
The RSX indicator appears in a separate window below the price chart. It includes:
Overbought and oversold zones
A moving average (MA) line that changes color based on trend direction
A broad center line at the zero level that shifts between green, red, and yellow
Yellow indicates indecision, green signals bullish sentiment, and red suggests bearish pressure. Traders use RSX for Scalping, intraday trading, and swing trading due to its clarity and responsiveness.
How to Use the RSX Indicator
Understanding RSX Levels
RSX values range from 0 to 100. These key levels help traders interpret market conditions:
Below 20 → Oversold zone
Above 80 → Overbought zone
When the indicator dips into oversold territory, a bullish reversal becomes more likely. When it climbs above 80, the asset is considered overbought, increasing the possibility of a downward reversal.
Buy Signal
A buy opportunity forms when:
The RSX moving average line turns lime green
The line shifts upward, demonstrating rising momentum
The center line also turns green
Price sits in or near the oversold region
This combination suggests a high-probability upward trend. When the color change aligns with Market Structure, traders can prepare to open long positions.
Sell Signal
A sell signal appears when:
The MA line turns pale violet red
The RSX indicator line also shifts to red
The market shows overbought characteristics
This combination indicates an impending bearish reversal. When both color and direction align, traders look for short entry points.
Exit Strategy
To exit trades effectively using RSX:
Exit long positions when the RSX indicator shifts to red during an uptrend
Exit short positions when the RSX indicator turns green during a downtrend
These color-based trend shifts are designed to protect traders from staying in trades after momentum fades.
Installing the RSX Indicator in MT4
The RSX is not included in the default MetaTrader 4 indicator list. You can download it for free at IndicatorForest.com. After downloading:
Open MT4
Navigate to File → Open Data Folder
Go to MQL4 → Indicators
Paste the RSX file
Restart MT4
Attach the indicator to your chart
This simple installation process lets you start analyzing markets instantly.
Trading Example
Consider a chart of GBP/AUD. When the RSX indicator’s center line turns green, it signals bullish pressure. Simultaneously, the moving average turns lime green and aligns with upward price movement—an ideal time to consider buying.
In another moment, the indicator shifts to red and begins to slope downward. The MA turns pale violet and mirrors the market’s decline. This synchronized behavior marks a strong sell signal.
The RSX frequently mimics price direction with accuracy, enabling traders to identify precise entries and exits.
Conclusion
The RSX indicator provides traders with dependable signals by eliminating noise and offering color-coded insights. Its trend-matching moving average and clear overbought/oversold zones help traders identify ideal entry and exit points across different trading styles. Whether you're scalping or swing trading, RSX improves signal clarity and supports trend-based decision-making.
For more trading tools and custom indicators, visit IndicatorForest.com.
FAQ
19 Downloads
Published:
Dec 06, 2025 02:43 AM
Category: