Precision Market Timing with the RSX Jbars Indicator
In the competitive world of Forex and CFD trading, the ability to filter out market noise and identify high-probability momentum shifts is the difference between a winning strategy and a losing one. Standard oscillators like the Relative Strength Index (RSI) are often plagued by jagged movements and false signals, especially during periods of high volatility. The RSX Jbars indicator for MetaTrader 4 (MT4) is a professional-grade evolution designed to eliminate these flaws, providing a mathematically smoothed and visually intuitive view of market velocity.
The Science of Jurik-Smoothed Momentum
The core of the RSX Jbars utility is based on the RSX algorithm—a "noise-free" version of the RSI. Unlike traditional smoothing methods that introduce significant lag, the RSX utilizes advanced signal-processing techniques to maintain extreme responsiveness to price changes while producing a smooth, sine-wave-like curve.
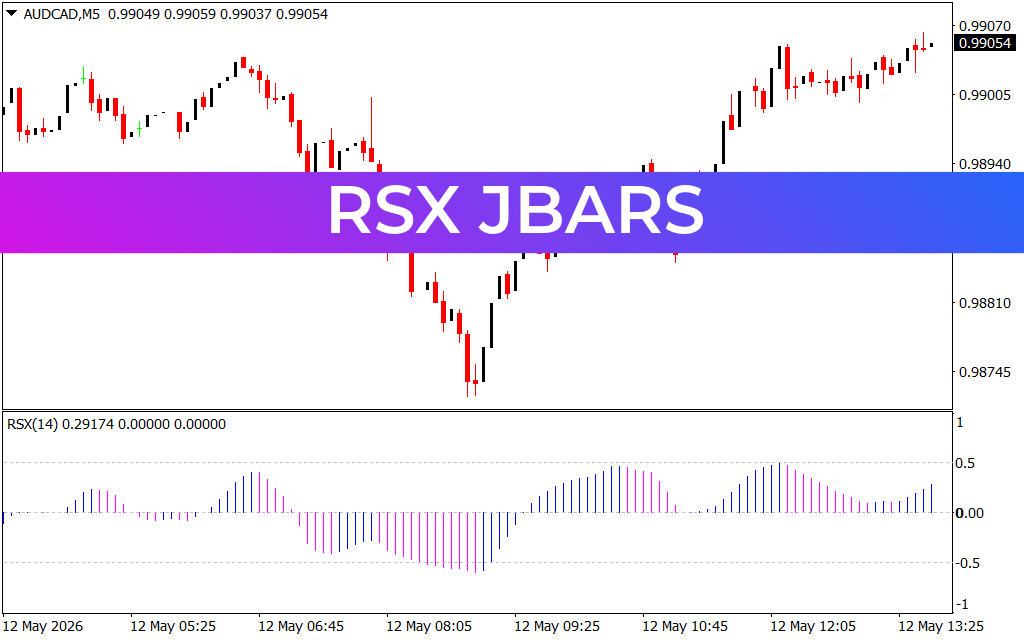
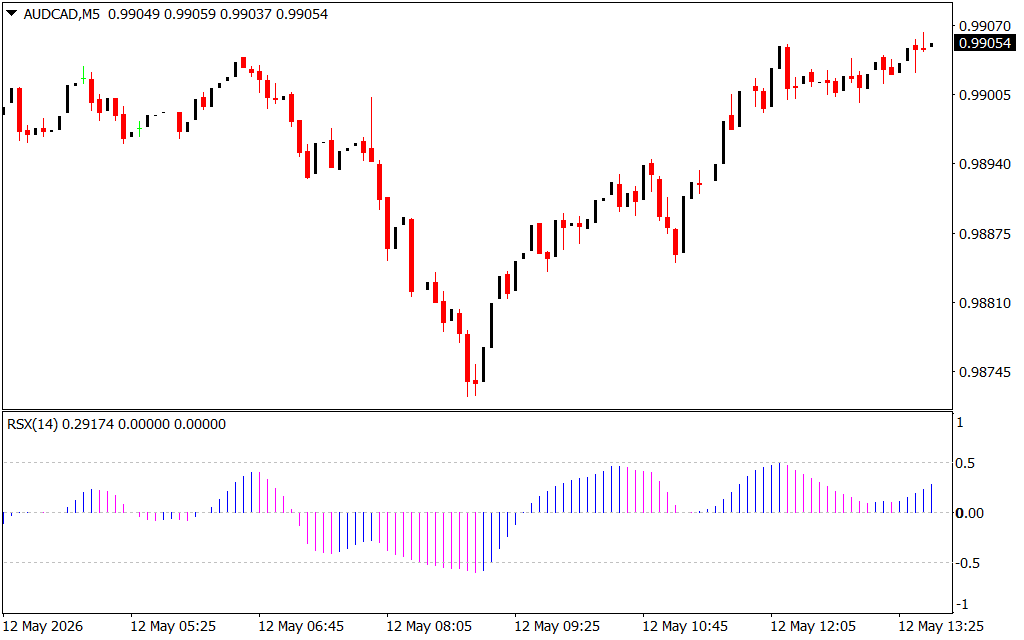
As demonstrated in the AUD/CAD M5 chart, the indicator is presented in a sub-window as a dynamic, color-coded histogram (Jbars):
- Purple/Pink Bars (Bullish Acceleration): When the bars rise above the zero-line and turn purple or pink, it indicates that bullish momentum is gaining strength. This visual cue helps traders confidently hold long positions during trend expansions.
- Blue/Cyan Bars (Bearish Acceleration): When the bars drop below the zero-line and turn blue, it signals that sellers have reclaimed control. These phases identify ideal opportunities for short-side entries or for tightening stop-losses on existing longs.
- The Zero-Line Cross: The most critical mechanical signal. A cross above zero suggests a bullish cycle is beginning, while a cross below zero indicates a bearish rotation.
Tactical Advantages for Day Traders and Scalpers
The RSX Jbars indicator is particularly effective for traders operating on lower timeframes where price "noise" is most prevalent:
- Spotting Hidden Divergence: Because the RSX is so smooth, divergence between price and the histogram becomes much easier to identify. A higher high in price matched with a lower high in the RSX Jbars often predicts a significant reversal before it happens.
- Precise Entry and Exit Timing: The color-coded bars remove the guesswork from technical analysis. Traders can wait for a color change as a definitive trigger to execute a trade, ensuring they are always moving in harmony with the current momentum.
- Filtering Sideways Markets: During periods of consolidation, the RSX Jbars stay close to the zero-line with small bar heights. This warns traders to stay on the sidelines until a clear momentum breakout occurs.
- Versatility Across Assets: Whether you are trading major pairs like AUD/CAD or volatile indices, the RSX algorithm adapts to the specific volatility of the asset, providing consistent signals across all markets.
Strategic Integration
To maximize the power of RSX Jbars, it should be used as a momentum confirmation tool alongside structural analysis. For example, if price reaches a major Fibonacci support level and the RSX Jbars flip from blue to pink, you have a high-confluence signal for a long entry.
By upgrading your MT4 platform with the RSX Jbars indicator, you gain an institutional-grade perspective on market momentum. It transforms complex price data into a clear, actionable histogram, allowing you to trade with the precision and confidence required for long-term success.
4 Downloads
Last Update:
May 12, 2026 16:50 PM
Published:
Jan 23, 2026 13:24 PM
Category: