Capture Precise Market Momentum with the RVI Indicator
In high-frequency forex trading, distinguishing between sustainable market expansion and an overextended, exhausted trend is a constant challenge. Many retail day traders rely solely on traditional momentum tools that struggle to isolate structural shifts during volatile sessions, leading to premature entries and missed exits. The RVI Indicator (Relative Vigor Index) for MetaTrader addresses this issue by analyzing the structural strength of price movement, helping scalpers and swing traders enter high-probability setups with institutional precision.
The Science Behind Relative Vigor Index Momentum
The RVI Indicator operates as a sophisticated, dual-line momentum oscillator positioned in a dedicated sub-window below your primary candlestick screen. Rather than tracking price velocity in isolation, the core mathematical algorithm is built on a fundamental market premise: in a healthy bullish trend, the closing price of a candlestick tends to sit higher than its opening value. Conversely, in a dominant bearish environment, the closing price naturally gravitates toward the lower boundary of the candle's total high-low range.
By smoothing these calculations with a moving average framework, the indicator filters out random market noise to present an objective view of buying and selling pressure.
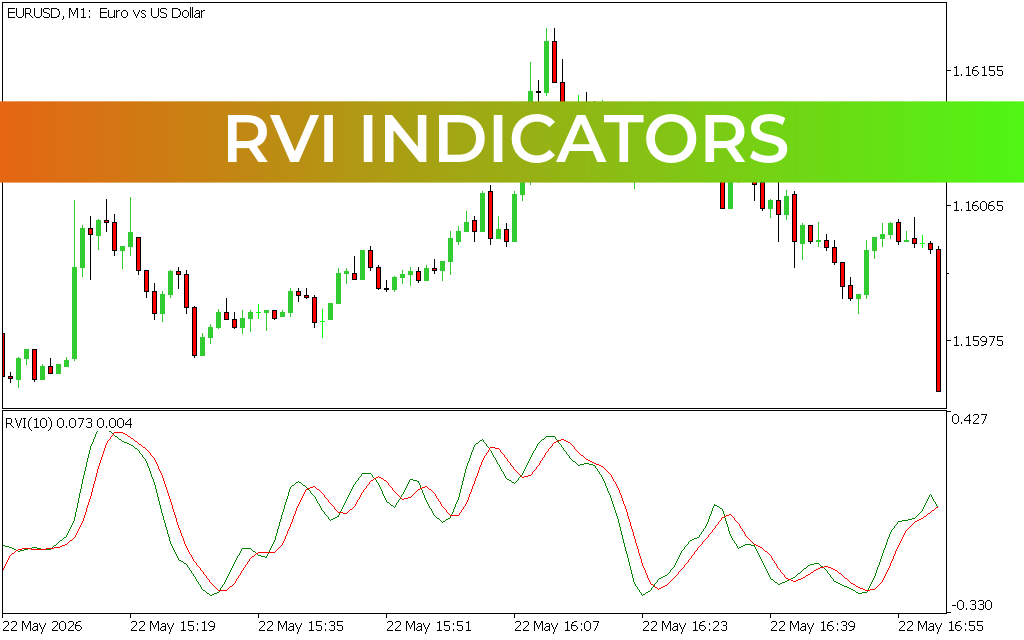
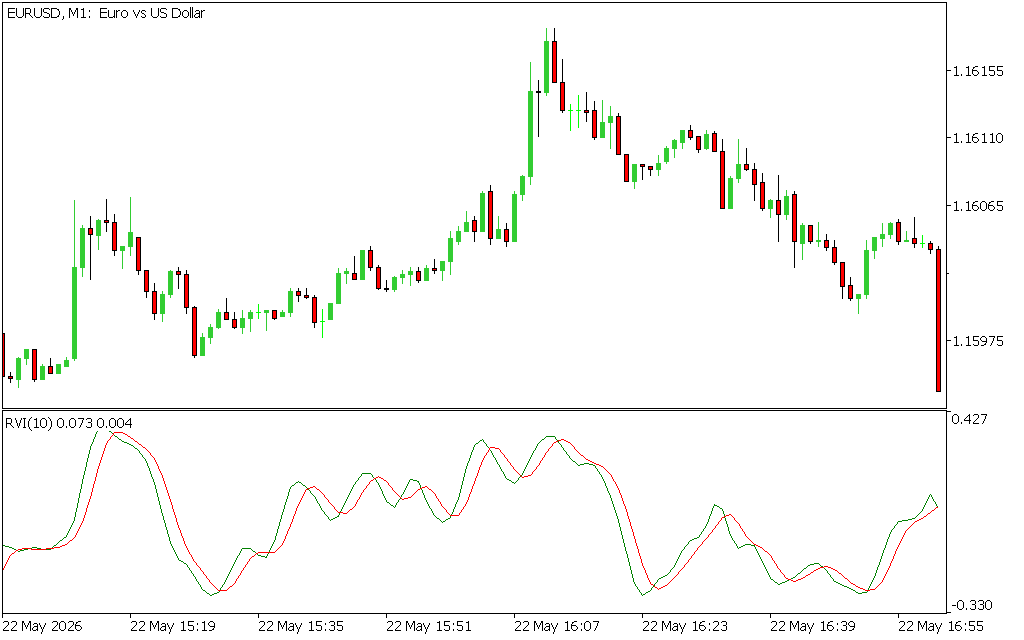
As displayed on the EURUSD 1-minute chart, the utility builds a clean visual trading matrix:
- The Fast-Reacting RVI Line (Green): This primary vector tracks immediate changes in price behavior, mapping out minor shifts in localized velocity.
- The Smoothed Signal Line (Red): Positioned alongside the green line, this boundary acts as a trailing guidepost to confirm macro-driven trend directions.
- The Center Equilibrium Axis: The center line marks the 0.00 baseline. When the lines diverge significantly from this mid-point, it signals an overextended market phase ripe for a mean-reversion rotation.
Key Trading Features and Technical Advantages
- Objective Momentum Smoothing: Eliminates erratic chart variations, allowing you to confidently hold profitable positions through minor intraday pullbacks.
- Clear Reversal Identification: The dual-line crossovers give clear, rule-based entry and exit signals right at key market inflection points.
- Excellent Workspace Hygiene: Confining the oscillator to a bottom pane ensures your primary panel remains clean for tracking naked candlesticks or historical trendlines.
- Versatile Multi-Asset Framework: While delivering incredible structural feedback for high-frequency scalpers on the 1-minute chart, the settings adapt seamlessly to higher timeframes like H1 or D1.
Execution Strategies for Strategic Position Management
To translate the RVI Indicator into a reliable technical system, weave its visual crossovers into a disciplined execution routine:
- The Pure Momentum Cross: Monitor the oscillator lines in the bottom window. When the green RVI line crosses cleanly above the red signal line from beneath, it confirms a surge in buying pressure—validating an immediate long entry.
- The Zero-Line Filter: Increase your statistical edge by using the 0.00 baseline as a direction filter. Only accept bullish crossovers that take place below the zero line, ensuring you buy the asset at a deep value discount.
- Calibrated Capital Protection: Anchor your protective stop-losses slightly beyond the recent structural swing high or swing low printed on your main candlestick workspace. This keeps your downside risk completely defined while chasing explosive momentum expansions.by accessing this free tool at IndicatorForest.com.
Last Update:
May 22, 2026 20:31 PM
Published:
Jan 17, 2026 15:07 PM
Category: