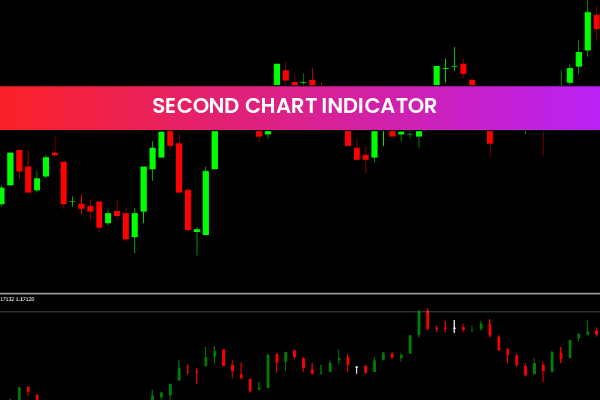
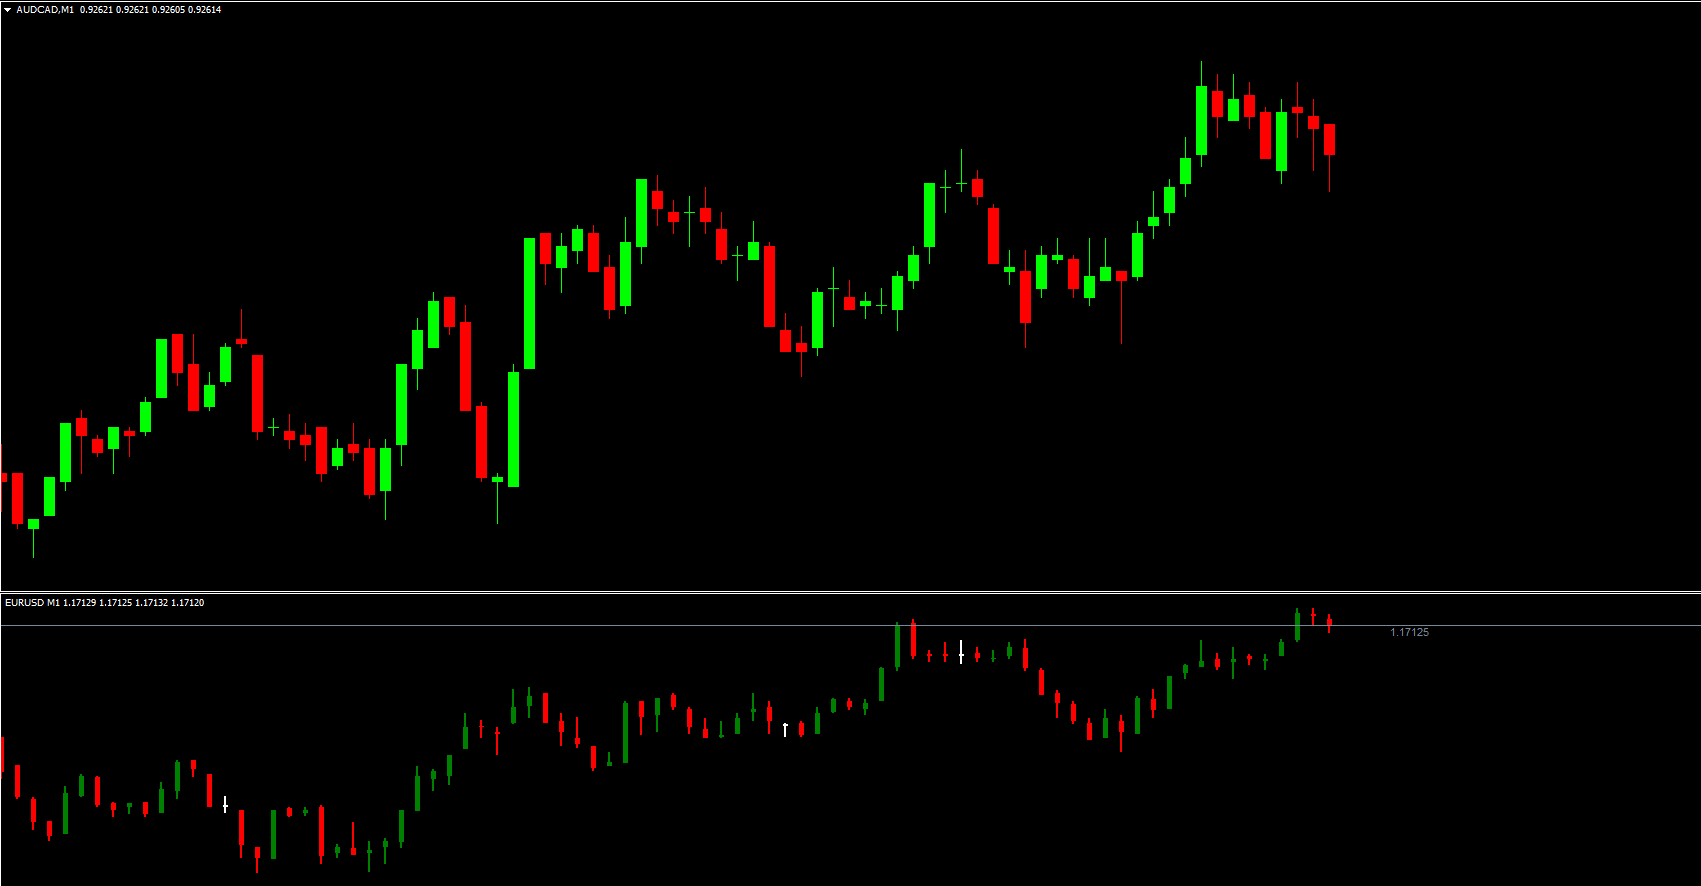
The Second Chart Indicator is a useful and popular free Forex Indicator for the MetaTrader 4 (MT4) platform. It is specifically designed to help traders analyze price action more effectively by displaying two price charts on the same timeframe. This unique approach allows traders to compare current market behavior with previous price movements, leading to more accurate and confident trading decisions.
By visually aligning historical and current price action, the Second Chart Indicator provides valuable insight into trend continuation, trend changes, and potential market reversals.
How the Second Chart Indicator Works
The Second Chart Indicator overlays two synchronized charts on a single MT4 window:
The primary chart displays the current price action.
The secondary chart shows the price action from the previous period.
This side-by-side comparison makes it easier to spot similarities, differences, and repeating market behavior. Traders can instantly see how price reacted in the past under similar conditions, which can help anticipate future movement.
Key Features of the Second Chart Indicator
Dual Chart Display
Shows current and previous price action on the same timeframe.
Trend Identification
Helps traders recognize Trend Continuation and trend shifts.
Support And Resistance Analysis
Assists in spotting recurring price levels where the market previously reacted.
Reversal Detection
Makes it easier to identify potential market reversals by comparing price structure.
Easy to Use
Simple installation and configuration on the MT4 platform.
Free MT4 Indicator
Available at no cost, making it accessible to all Forex traders.
How the Second Chart Indicator Can Benefit You
Improve Market Analysis
Quickly compare historical and current price behavior without switching charts.
Better Trade Timing
Identify high-probability entry and exit points based on past price reactions.
Understand Market Structure
Gain a clearer view of price patterns, breakouts, and consolidations.
Save Time
Eliminates the need to manually scroll back and forth through price history.
Suitable for All Trading Styles
Works well for Scalping, day trading, swing trading, and long-term strategies.
How to Use the Second Chart Indicator Effectively
Add the Second Chart Indicator to your MT4 chart.
Observe how the previous period’s price action compares with the current market.
Look for repeating patterns such as breakouts, pullbacks, or consolidations.
Use the indicator to confirm trend direction before entering a trade.
Combine it with indicators like moving averages, RSI, or support and resistance tools for stronger confirmation.
When used correctly, the Second Chart Indicator can significantly improve decision-making accuracy and help traders avoid impulsive trades.
Why Traders Choose the Second Chart Indicator
Traders favor the Second Chart Indicator because it provides context to price movement. Instead of analyzing price in isolation, traders gain a broader perspective by directly comparing current behavior with historical data. This approach helps reduce uncertainty and improves trade confidence.
For more professional and free MT4 Forex indicators, visit IndicatorForest.com and explore a growing library of powerful trading tools.
Final Thoughts
The Second Chart Indicator is a powerful yet simple MT4 Forex tool that helps traders compare price action, identify trends, and spot potential reversals. Its dual-chart visualization offers a unique advantage for understanding market behavior and improving overall trading performance.
Call to Action:
Discover more free MT4 Forex indicators and enhance your trading strategies today at IndicatorForest.com.
1 Download
Published:
Jan 13, 2026 00:16 AM
Category: