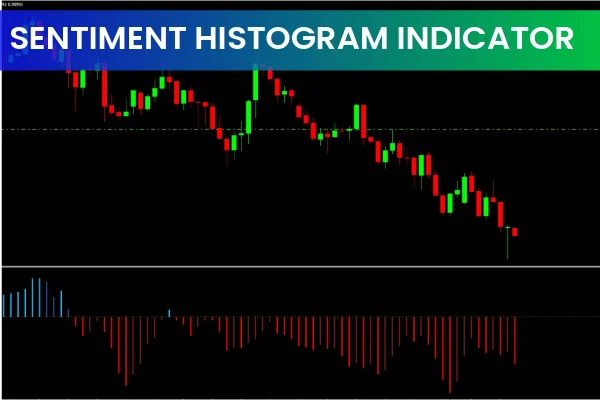
The Sentiment Histogram Indicator for MT4 is a powerful tool for identifying BULLISH and BEARISH market conditions using a color-coded histogram. By showing trend progression and retracements around a zero line, this indicator provides clear BUY and SELL signals as well as early warnings for potential trend reversals.
How the Sentiment Histogram Indicator Works
The indicator plots multiple colored histogram bars in a separate window with a white dotted Zero line. Each color represents a specific trend condition:
ROYAL BLUE: Bullish trend progressing.
DEEP SKY BLUE: Bullish retracement.
FIRE BRICK: Bearish trend progressing.
RED: Bearish retracement.
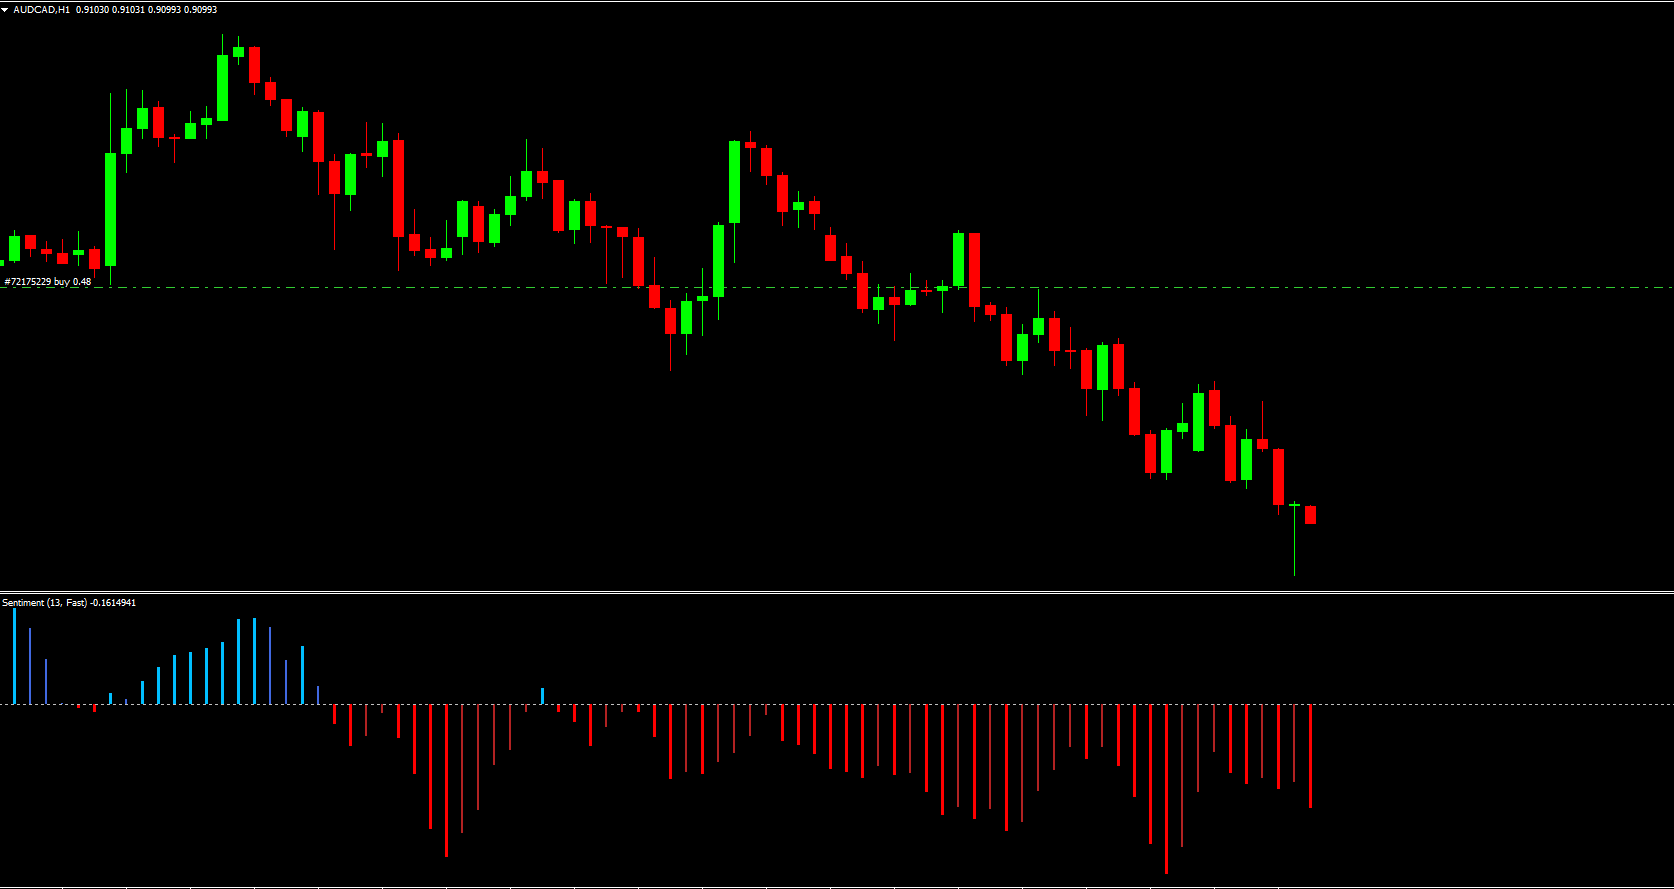
When the histogram is above the zero line, it indicates a bullish market, suggesting a potential BUY trade. Traders can place a stop loss below the previous swing low and hold the position as long as the histogram remains bullish. Conversely, when the histogram moves below the zero line and turns red, it indicates a bearish market, signaling a SELL trade. Stop losses should be placed above the previous swing high.
Advantages of the Sentiment Histogram Indicator
Visual Trend Analysis: Easily identify bullish and bearish market conditions.
Retracement Signals: Provides early warnings for potential trend reversals.
Multi-Timeframe Compatibility: Works on intraday, daily, weekly, and monthly charts.
Beginner-Friendly: Simple visual representation for traders of all levels.
Automation Ready: Can be incorporated into EAs and automated trading systems.
Free Download: Easy to install and available at IndicatorForest.com.
Tips for Trading with the Sentiment Histogram Indicator
Use higher timeframes to determine the overall trend direction.
Use lower timeframes to find precise entry points.
Combine with other trend-following indicators to confirm trades.
Plan exits using retracement bars, opposite signals, or a proper risk-reward ratio.
Conclusion
The Sentiment Histogram Indicator for MT4 is an effective visual tool for forex traders, providing clear buy and sell signals and early warnings of trend reversals. With its color-coded histogram bars, traders can identify market sentiment and make informed trading decisions. You can download the Sentiment Histogram Indicator for free from IndicatorForest.com and start using it independently or alongside other trend-following tools today.
FAQ
2 Downloads
Published:
Nov 18, 2025 00:07 AM
Category: