The Sibbet Demand Index is a powerful trading tool for MetaTrader 4 (MT4) that helps traders measure market demand and supply by analyzing buying and selling pressure. By quantifying market momentum, this indicator allows traders to spot Trend Strength, early reversals, and potential entry and exit points with greater accuracy.
Designed for Forex, commodities, indices, and cryptocurrency traders, the Sibbet Demand Index works effectively across all timeframes—from Scalping on M1 charts to swing trading on daily or weekly charts. Whether you’re a beginner or a professional trader, this tool provides clear insights into market sentiment and order flow dynamics.
How the Sibbet Demand Index Works
The Sibbet Demand Index calculates the net buying and selling pressure by analyzing the relationship between price movement and volume over a defined period.
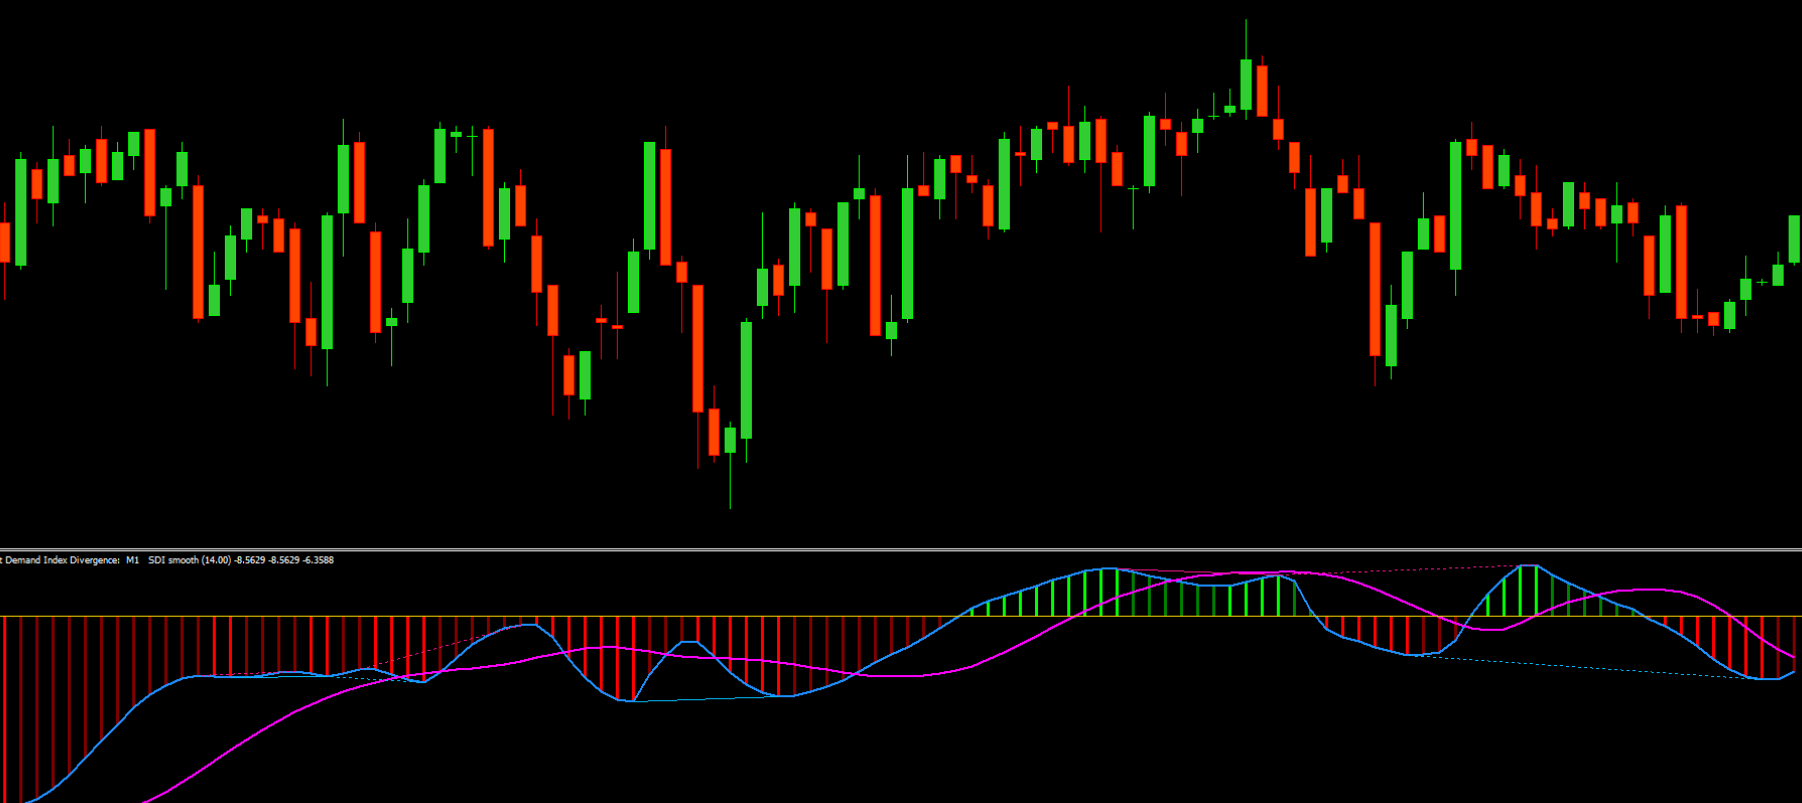
Positive Index Values: Indicate that buying pressure dominates, signaling a potential upward trend.
Negative Index Values: Suggest selling pressure is stronger, indicating possible downward momentum.
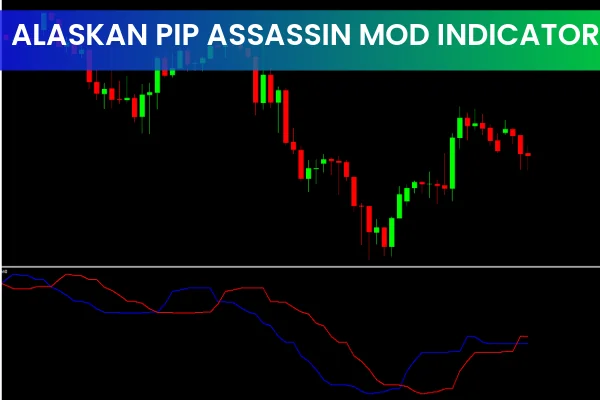
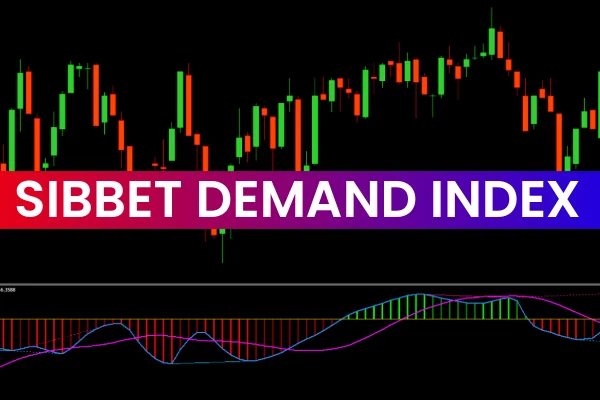
The indicator is displayed as a histogram or line chart below the price chart, making it easy to interpret at a glance. Traders can quickly determine whether the market is driven by bulls or bears and adjust their strategies accordingly.
Key Features and Benefits
Market Demand & Supply Analysis
Provides a clear picture of buying and selling pressure to understand trend dynamics and potential reversals.✔ Trend Strength Assessment
Helps traders confirm strong trends and avoid trading against dominant market moves.
Early Reversal Signals
Identifies potential turning points before price reacts, offering an advantage in timing entries and exits.
Multi-Timeframe Support
Works effectively on M1, M15, H1, D1, and Weekly charts, making it suitable for scalpers, day traders, and swing traders.
Easy-to-Read Interface
The histogram or line display ensures that both beginners and advanced traders can quickly interpret market conditions.
Practical Trading Applications
The Sibbet Demand Index can be used alone or combined with other technical indicators for improved accuracy:
Confirm Trend Direction
Use the index to validate the current trend before entering trades based on moving averages or Price Action.
Spot Reversals
Look for divergence between price and the index to anticipate market turning points.
Identify Overbought & Oversold Conditions
Extreme positive or negative values often indicate overextended market conditions, providing potential exit or entry opportunities.
Combine With Volume Analysis
Enhance signals by pairing the Sibbet Demand Index with volume or momentum indicators for better confirmation.
By applying these strategies, traders can make more informed decisions and increase the probability of successful trades.
Why Traders Prefer the Sibbet Demand Index
Traders choose the Sibbet Demand Index because it provides actionable insights into market demand and supply, helping to identify high-probability trade setups. Its visual clarity, non-repainting behavior, and compatibility with multiple timeframes make it a versatile and reliable tool for any trading strategy.
Conclusion
The Sibbet Demand Index for MT4 is an essential tool for traders who want to analyze market demand, assess trend strength, and detect early reversals. By integrating this indicator into your trading strategy, you can trade with better timing, improved precision, and greater confidence.
👉 Download the Sibbet Demand Index today from IndicatorForest.com and enhance your trading with professional-grade tools and insights.
FAQ
1 Download
Published:
Dec 09, 2025 01:17 AM
Category: