Maximize Your Trading Edge with the Sibbets Demand Index Arrows Alert
In the complex world of financial markets, understanding the relationship between price movement and buying or selling pressure is essential for long-term success. The Sibbets Demand Index Arrows Alert is a premier technical analysis tool for MetaTrader 4 that combines the legendary Sibbets Demand Index formula with modern visual signaling. By quantifying the intensity of demand and supply, this indicator allows traders to identify explosive trend reversals and momentum shifts before they are fully visible on the price chart.
The Science of Demand and Supply
The Demand Index was originally developed by James Sibbet to measure the "push and pull" of market participants. Unlike standard volume oscillators that only track the number of shares or lots traded, the Demand Index incorporates price velocity and volatility to determine the quality of that volume. It effectively answers the question: "Is the current price move supported by significant institutional buying or selling?"
The indicator is visualized through two powerful components:
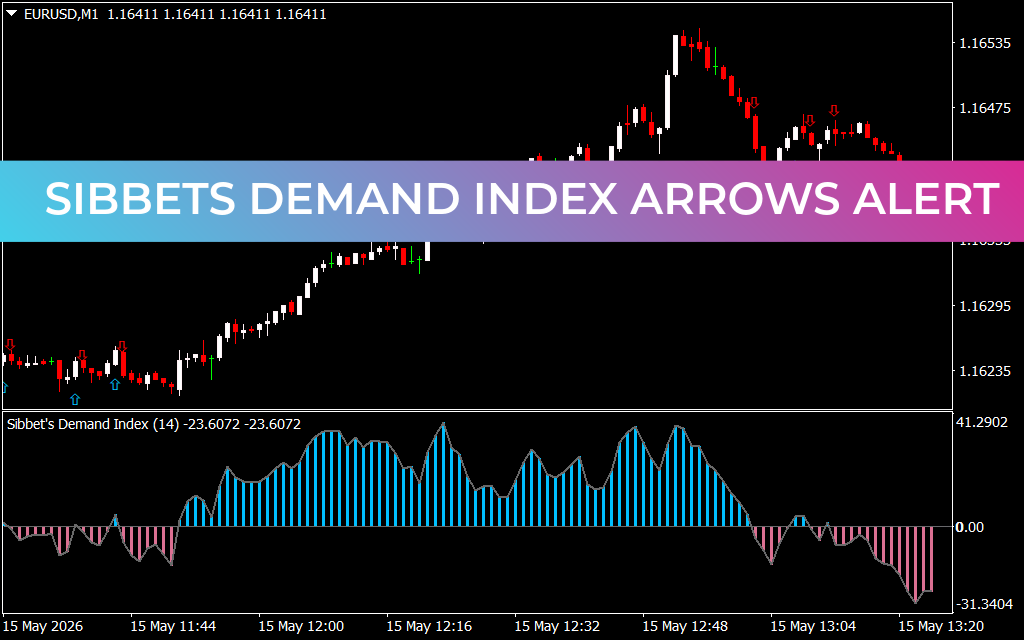
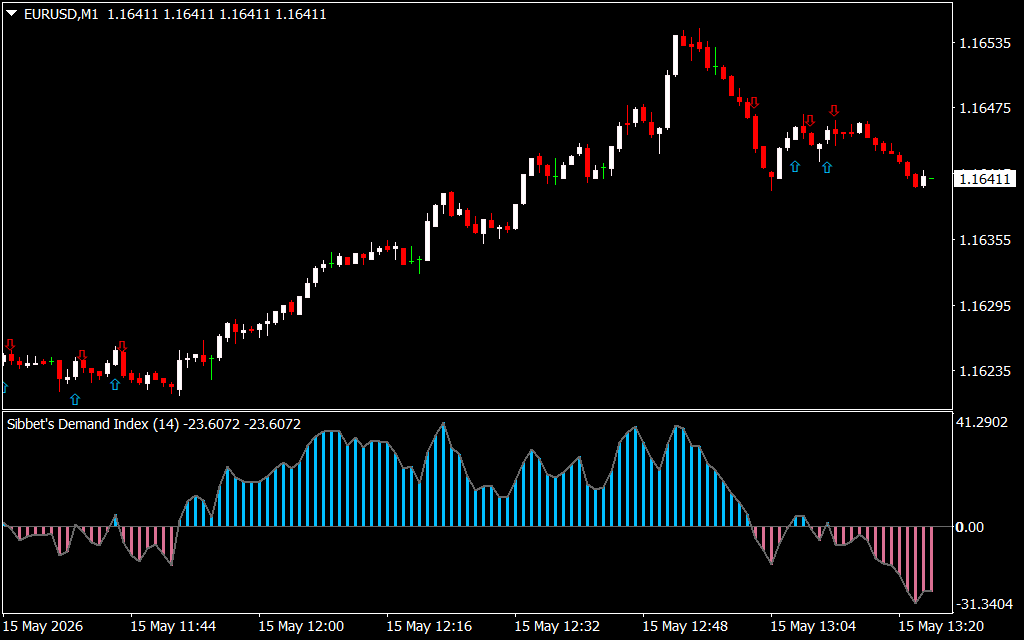
- The Histogram Oscillator: A zero-line based histogram where blue bars represent dominant buying pressure and red bars represent dominant selling pressure. The height of the bars indicates the relative strength of the demand or supply.
- The Arrows Alert System: To simplify decision-making, the indicator features automated arrows (blue for Buy, red for Sell) directly on the price chart. These arrows trigger when the index crosses critical thresholds or shifts momentum, providing immediate actionable signals.
Strategic Execution: Scalping and Trend Following
As seen in the EURUSD M1 chart, the Sibbets Demand Index Arrows Alert is a game-changer for short-term scalpers. In fast-moving markets, price "noise" can often create false breakouts. This indicator acts as a high-fidelity filter:
- Leading Reversal Signals: When price makes a new high but the Demand Index histogram shows a lower peak, it signals a bearish divergence. A red arrow alert at this stage provides a high-probability entry for a Trend Reversal.
- Momentum Confirmation: During a strong upward move, as long as the histogram remains in the blue "demand" zone above the zero line, traders can hold their positions with confidence, knowing the trend is backed by real market pressure.
- Zero-Line Crossover: A crossover from the red zone into the blue zone, accompanied by a blue arrow, indicates that buyers have officially taken control of the market regime.
Why Traders Choose Sibbets Demand Index
The primary advantage of the Sibbets Demand Index Arrows Alert is its ability to lead the market rather than follow it. While moving averages rely solely on past price data, the Demand Index looks at the internal mechanics of market participation.
- Precision Alerts: The built-in alert system ensures you never miss a high-probability setup, even if you are managing multiple currency pairs.
- Visual Clarity: The clean distinction between demand (blue) and supply (red) removes the psychological hesitation often associated with complex charting.
- Multi-Asset Utility: Whether you are trading Forex majors, Commodities, or Indices, the mathematical logic of the Demand Index remains a robust measure of market psychology.
By integrating the Sibbets Demand Index Arrows Alert into your trading toolkit, you gain a deep-level understanding of market momentum, allowing you to trade with the "smart money" and navigate the markets with surgical precision.
1 Download
Last Update:
May 15, 2026 16:25 PM
Published:
Jan 21, 2026 20:04 PM
Category: