Master Trend Reversals with the SIG CCI Indicator
In the competitive world of Forex trading, identifying the exact moment a trend exhausts itself is the "holy grail" for many investors. The SIG CCI Indicator is a sophisticated technical tool designed to solve this puzzle. By enhancing the classic Commodity Channel Index (CCI) with advanced signal processing, this indicator provides traders with clear, actionable entry points that cut through market noise.
What is the SIG CCI Indicator?
The SIG CCI is a modernized version of the standard CCI oscillator. While the traditional CCI measures the current price level relative to an average price level over a given period, the SIG version focuses on "signals" (SIG) generated by momentum shifts. Instead of requiring the trader to manually interpret oscillating lines, the SIG CCI automates the process by placing visual cues directly onto the price chart.
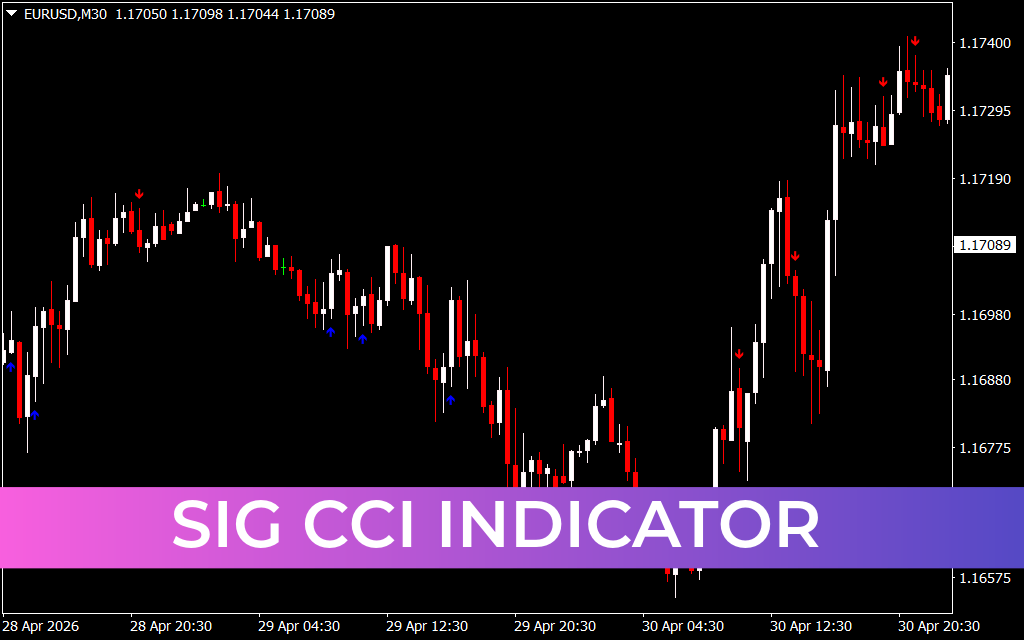
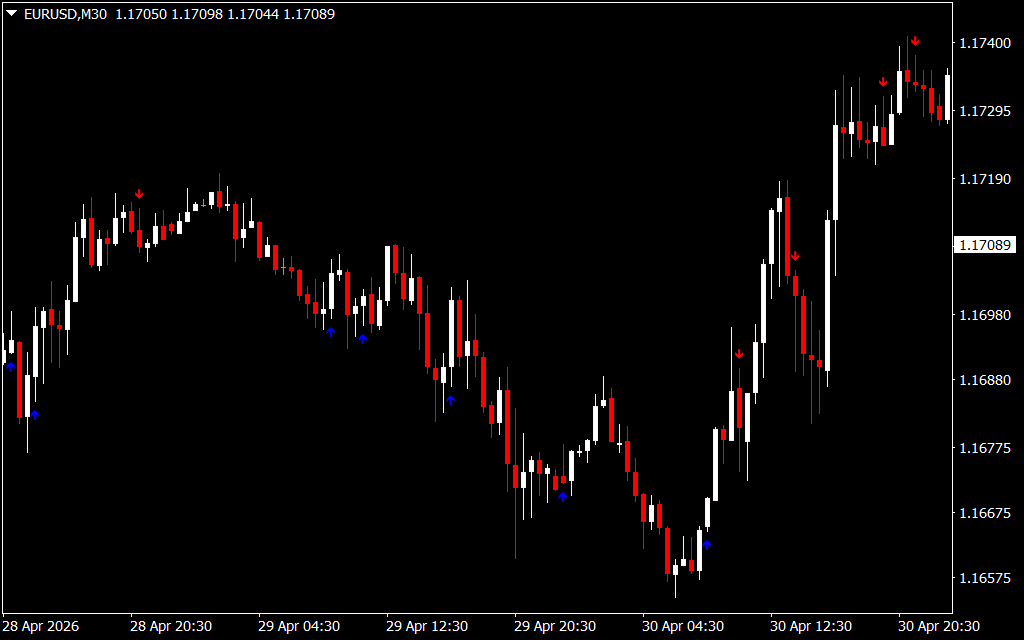
As shown in the provided chart, the indicator utilizes color-coded arrows to signify potential market turns. This visual approach simplifies technical analysis, making it an excellent choice for both novice traders and seasoned professionals looking for a cleaner chart interface.
Key Features and Benefits
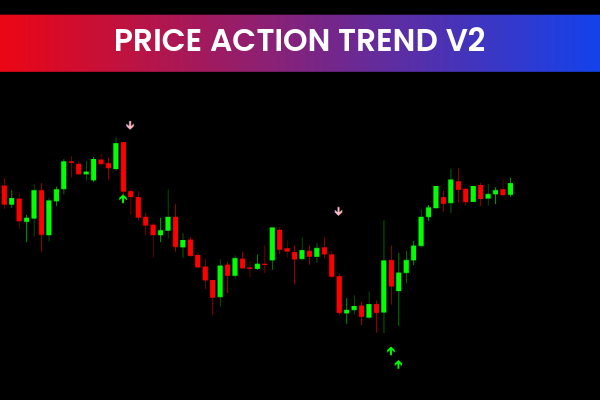
- Intuitive Visual Signals: The indicator identifies overbought and oversold conditions and marks them with arrows. Blue arrows pointing up suggest a bullish reversal, while red arrows pointing down indicate a bearish opportunity.
- Momentum-Based Accuracy: By calculating the velocity of price changes, the SIG CCI helps you avoid "fake-out" movements that often trap retail traders.
- Universal Compatibility: This indicator is highly versatile. It performs effectively across major currency pairs, commodities, and indices, allowing you to diversify your trading portfolio.
- Timeframe Flexibility: Whether you are a scalper looking for quick gains on the 5-minute chart or a swing trader analyzing the 4-hour trend, the SIG CCI can be tuned to suit your specific strategy.
How to Trade with SIG CCI
The most effective way to utilize the SIG CCI is to treat it as a confirmation tool within a broader trading system.
- The Bullish Entry: When price enters a known support zone and a blue arrow appears, it signals that momentum is shifting upward. This is a high-probability zone to open a long position.
- The Bearish Entry: Conversely, when price hits a resistance level and a red arrow appears, it indicates that the buying pressure is fading. This serves as a clear signal to consider a short trade.
- Risk Management: Professional traders often place their stop-loss just above the most recent swing high (for sells) or below the swing low (for buys) identified by the indicator's signal.
Conclusion
The SIG CCI Indicator takes the guesswork out of technical analysis. By providing precise, visual signals based on mathematical momentum shifts, it allows you to trade with the wind at your back. Stop struggling with lagging indicators and start using a system designed to highlight reversals before they happen. Equip your trading platform with the SIG CCI and take a disciplined approach to the markets today.
4 Downloads
Last Update:
May 05, 2026 20:11 PM
Published:
Jan 27, 2026 14:24 PM
Category: