Maximize Your Trading Precision with the Simple Volume Indicator
In the financial markets, price alone only tells half the story. While a sudden candlestick spike can look like the start of an aggressive new trend, it often lacks the structural backing to sustain itself, trapping retail traders in nasty false breakouts. To truly understand market intent, you need to look behind the curtain at what drives price: market liquidity. The Simple Volume indicator for MetaTrader is engineered to give you this exact insight, translating transaction activity into a clean, highly actionable visual sub-window.
Why Volume Analysis is Crucial for Forex Traders
Unlike centralized stock exchanges where absolute shares are tracked, the decentralized forex market relies on tick volume—the frequency of price changes within a given timeframe. Tick volume serves as an exceptional proxy for institutional activity. When major banks and hedge funds inject liquidity into a currency pair, transaction frequency surges.
The Simple Volume indicator acts as an objective filter, letting you see exactly when institutional money is participating in a move and, more importantly, when they are staying on the sidelines.
Decoding the Simple Volume Sub-Window
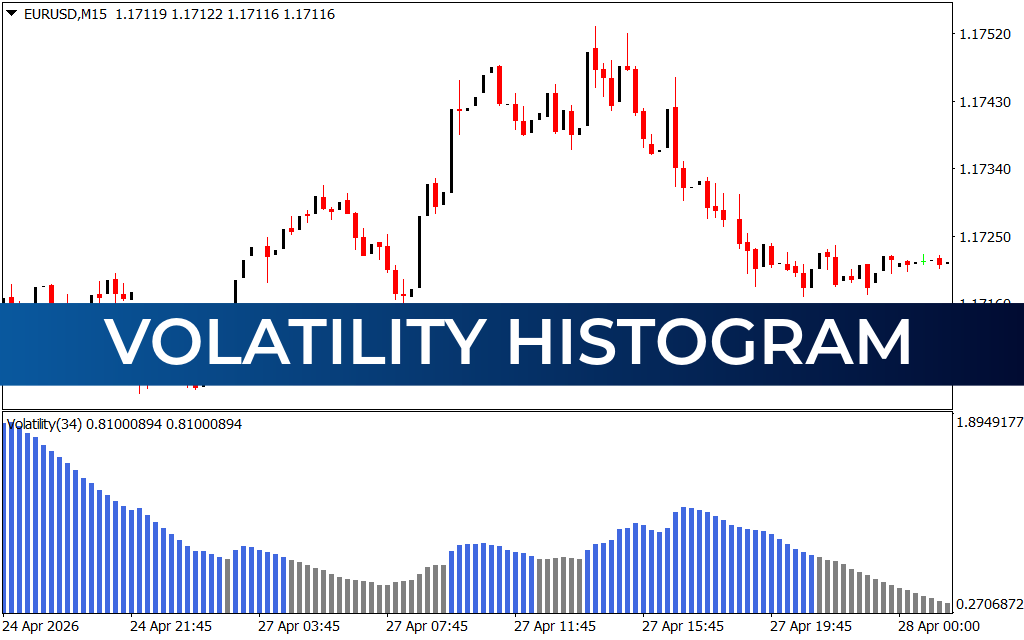
Many standard volume tools overload your workspace with confusing colors and shifting averages that obscure real-time data. This indicator strips away the complexity, placing an uncluttered volume histogram directly beneath your primary candlestick chart.
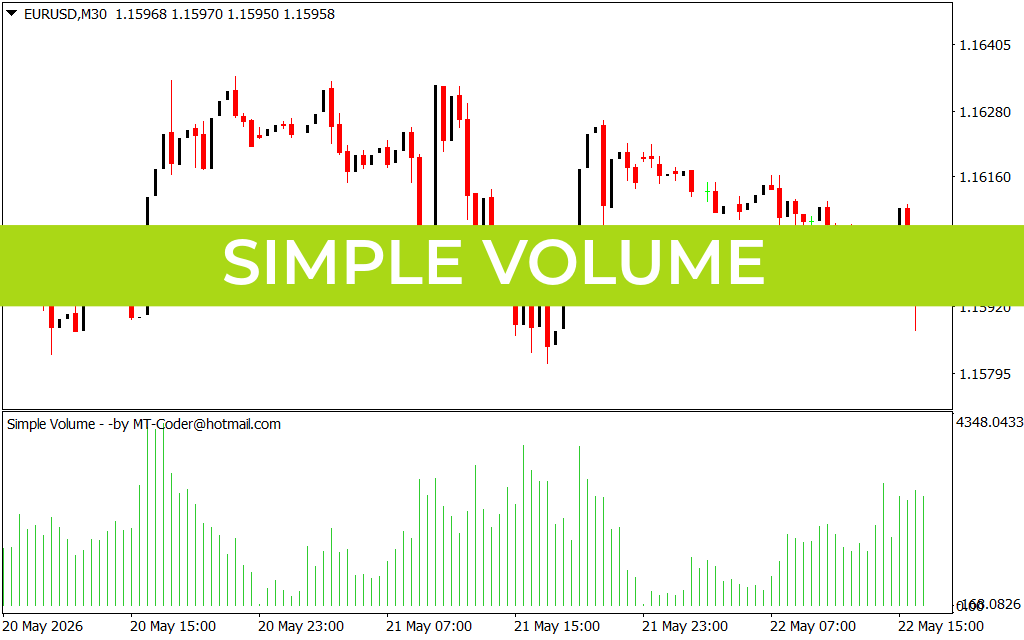
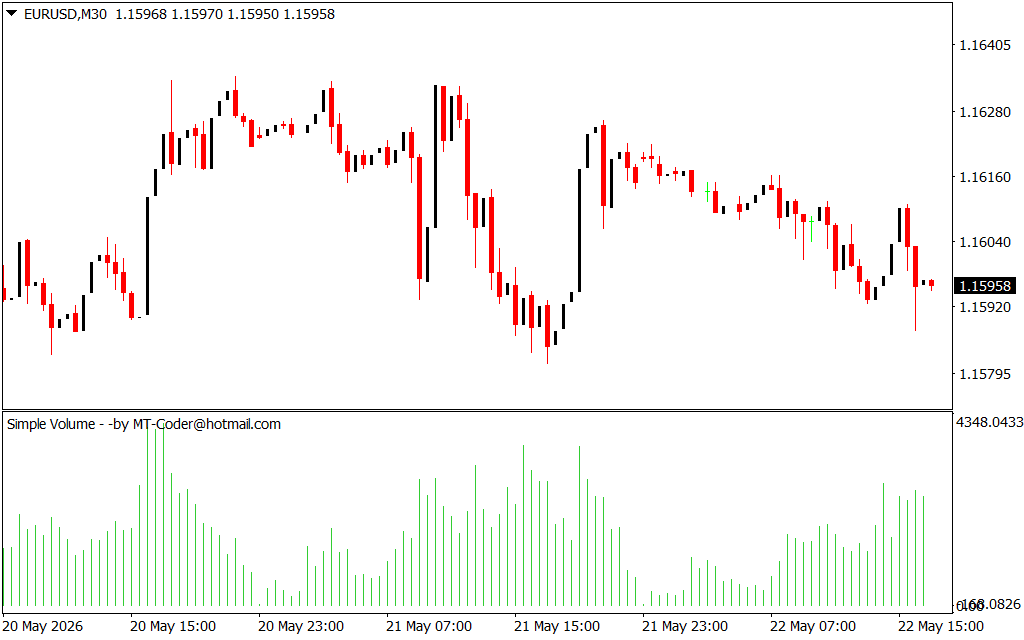
As displayed on the EURUSD M30 chart, the layout focuses on pure data delivery:
- Unified Vertical Histogram: Elegant green vertical bars plot the exact tick volume intensity for every individual 30-minute session.
- Proportional Scaling: The height of each bar corresponds to market velocity. High-standing peaks represent massive order execution, while flat, low-lying bars signal a low-liquidity environment.
- Maximum Chart Real Estate: By isolating the volume metrics to the bottom pane, your primary workspace remains completely open for drawing trendlines, finding chart patterns, and spotting candlestick rejections.
Strategic Trade Execution Using Simple Volume
To turn raw volume data into a highly profitable trading edge, integrate the indicator's vertical bars as a core confirmation filter within your execution strategy:
- Validating Structural Breakouts: When price attempts to break out of a major support or resistance zone, check the Simple Volume pane. A true breakout requires institutional backing, which is confirmed by a prominent volume spike. If a breakout occurs on low, flat bars, it is highly likely a fakeout.
- Identifying Trend Exhaustion: During a prolonged market expansion, look for scenarios where price makes a fresh swing high, but the corresponding volume bars begin to flatten or shrink. This divergence reveals that institutional buying pressure is drying up, serving as an early warning to tighten trailing stop-losses.
- Bypassing the Intraday Chop: During periods of extremely low volume—such as the late New York session or structural distributions—the histogram flattens toward the zero boundary line (as seen in the market lulls on the chart). Successful traders use this visual cue to sit on their hands and protect capital from directionless market chop.
1 Download
Last Update:
May 22, 2026 20:02 PM
Published:
Jan 17, 2026 16:31 PM
Category: