Reading Market Activity with the Simple Volume Indicator
In technical analysis, price tells you what the market is doing, but volume tells you how much conviction is behind that move. While many retail traders focus exclusively on candlestick formations and geometric patterns, institutional players look at trading activity to validate structural breakouts and trend sustainability. For MetaTrader users seeking an unfiltered view of market participation, the Simple Volume Indicator is a core component for building a robust trading system.
By displaying transaction activity clearly in a sub-window below your price chart, this utility strips away unnecessary complications, allowing day traders, scalpers, and swing traders to see exactly when major institutional money enters the arena.
Understanding the Simple Volume Framework
Unlike complex, smoothed volume oscillators that apply lag-inducing mathematical formulas, the Simple Volume Indicator focuses entirely on raw tick activity or real volume data over a specific bar interval.
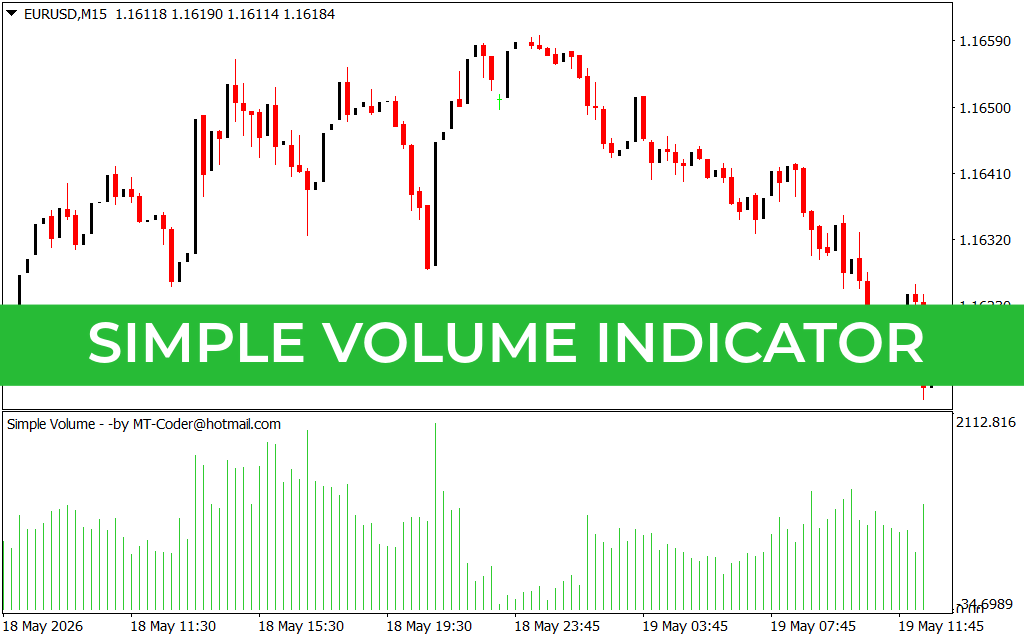
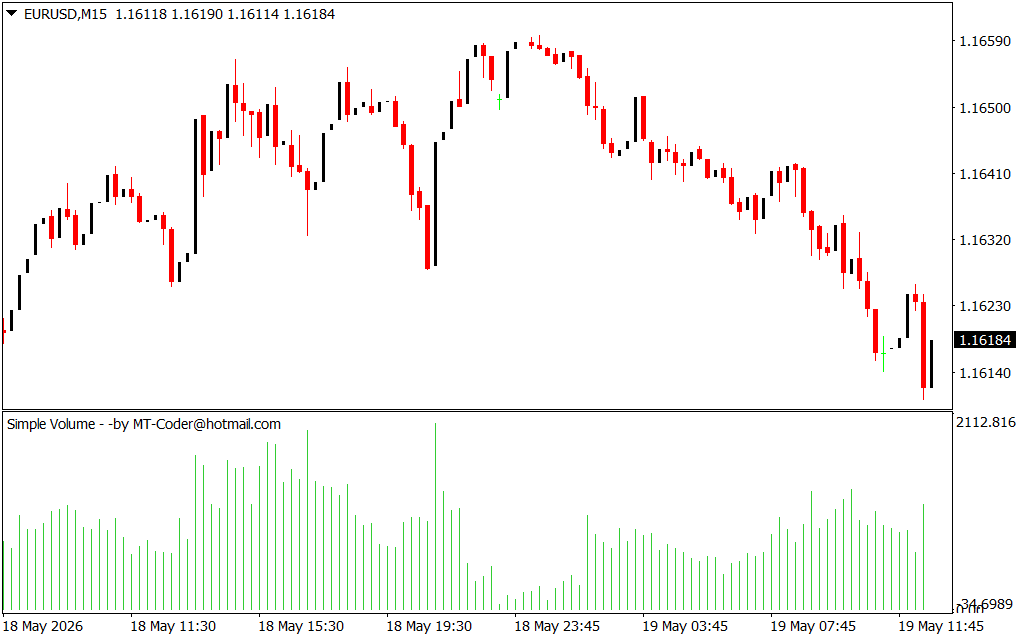
As showcased on the 1-minute or 15-minute (M15) charts, the indicator plots clean, vertical histogram bars along a variable scale:
- Tall Green Bars: Represent a surge in trading activity, indicating high market participation during that specific candlestick's duration.
- Short Green Bars: Highlight low-liquidity periods or quiet market sessions, signaling a lack of interest or consolidation.
Because foreign exchange is a decentralized market, this indicator tracks localized tick volume—the frequency of price changes per bar—which has been statistically proven to possess a near-perfect correlation with actual institutional trading volume.
Core Trading Strategies and Market Application
Integrating a clean volume histogram into your routine provides a major technical edge by confirming structural Price Action.
1. Validating True Breakouts
The most frequent trap for retail traders is a false breakout. When price tests a major horizontal support or resistance level and moves past it, the Simple Volume Indicator acts as a lie detector. If the price breaks a level on a massive surge of tall volume bars, it confirms that institutions are actively buying or selling the breakout. If the level is broken on flat or declining volume, it is highly likely a liquidity trap.
2. Spotting Reversal Exhaustion
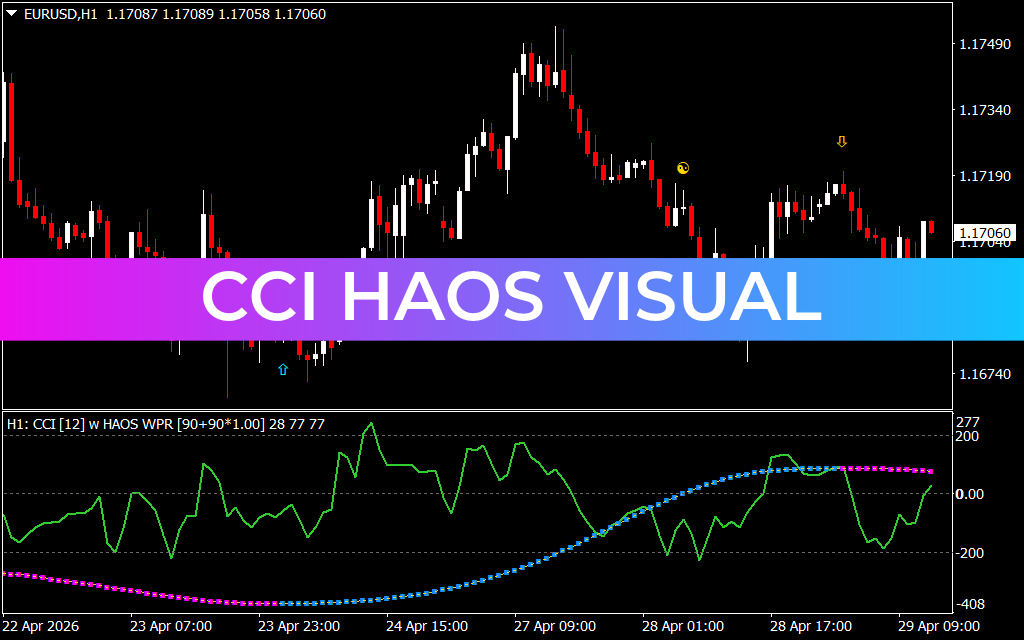
Volume helps traders identify when a trend is running out of steam. During an extended market markdown (such as the EUR/USD decline shown on the chart), if the price prints new lower lows but the volume bars become progressively shorter, it signals a lack of selling conviction. This classic volume exhaustion pattern frequently precedes a sharp bullish retracement.
3. Navigating Low-Liquidity Hazards
The indicator acts as an automated safety guide during session transitions. During the late New York or early Asian sessions, volume naturally bottoms out. Trading during these ultra-low volume environments can lead to wide spreads and unpredictable whipsaws, making the indicator an excellent tool for keeping you out of low-probability market environments.
Clarify Your Technical Perspective
The Simple Volume Indicator is an essential addition for any level-based trader looking to graduate from basic charting to advanced Market Structure. By providing immediate visual clarity regarding true market participation, it ensures you only risk capital when the market has the momentum to sustain a move.
3 Downloads
Last Update:
May 19, 2026 15:55 PM
Published:
Jan 19, 2026 19:55 PM
Category: