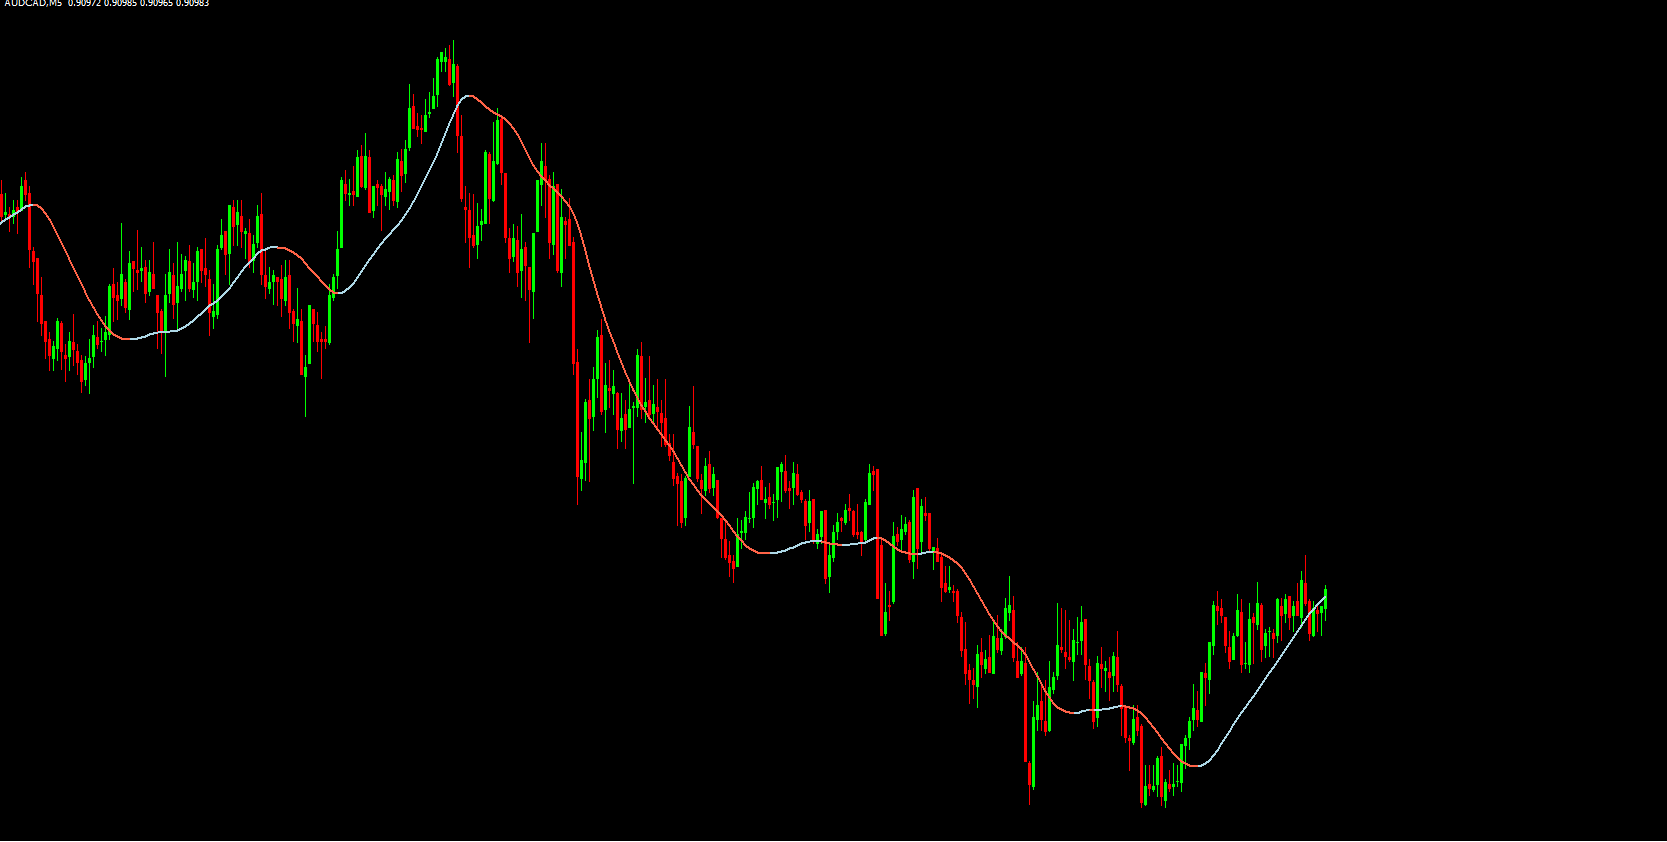
The Slope Direction Line Indicator for MT4 is a trend-following Forex Indicator designed to help traders identify the direction of price movements in the financial markets. By calculating the slope of a linear regression line, the indicator plots a dynamic line on the chart that visually represents bullish or bearish market bias.
This beginner-friendly indicator is ideal for scalpers, day traders, and swing traders, providing clear guidance on short- and medium-term trends. With its simple yet effective design, traders can quickly determine market sentiment and make informed trading decisions.
How the Slope Direction Line Indicator Works
The Slope Direction Line Indicator plots a single dynamic line on the MT4 chart with alternating colors:
Light Blue Line: Represents a bullish trend, indicating that the price is above the line and market sentiment is positive
Tomato Red Line: Represents a bearish trend, signaling that the price is below the line and market sentiment is negative
The slope of the line changes according to the linear regression calculation, allowing traders to visually gauge the market’s momentum and potential reversals. When the line maintains a consistent color, it confirms Trend Continuation, giving traders confidence to hold positions.
Key Features of the Slope Direction Line Indicator
The Slope Direction Line Indicator provides several features that make it a valuable MT4 tool:
Trend Identification: Quickly identifies bullish and bearish trends at a glance
Early Trend Reversal Signals: Detects potential trend changes through shifts in slope direction
Dynamic Visual Representation: Uses light-blue and tomato-red lines for easy interpretation
Supports Objective Decision Making: Can be combined with Price Action or other technical indicators
User-Friendly: Easy to install and understand, suitable for traders of all experience levels
Works on Multiple Timeframes: Effective for Scalping, day trading, and medium-term strategies
Benefits of Using the Slope Direction Line Indicator
Traders using the Slope Direction Line Indicator gain several advantages:
Assess Market Bias Quickly: Provides a visual representation of the current market trend
Enhance Trading Accuracy: Early slope changes indicate potential trend reversals
Improve Trade Decisions: Helps confirm entries and exits when used with other technical tools
Trend Continuation Confirmation: Maintained line color helps traders stay in profitable positions
Reduce Analysis Time: Simplifies trend recognition, making it easier to focus on executing trades
How to Use the Slope Direction Line Indicator Effectively
To make the most of this indicator:
Enter buy trades when the price is above the light-blue line and the slope is upward
Enter sell trades when the price is below the tomato-red line and the slope is downward
Combine with oscillators such as RSI or MACD to confirm trend strength
Use across multiple timeframes to validate trend consistency
Monitor for slope changes as early warnings for potential trend reversals
By integrating the Slope Direction Line Indicator into your MT4 trading strategy, you can make more informed and objective trading decisions, improving overall profitability and risk management.
Why the Slope Direction Line Indicator Is Popular
The Slope Direction Line Indicator is popular because it simplifies trend detection and provides a clear visual signal for market direction. Its dynamic slope line makes it easy for traders to spot trends, confirm reversals, and assess market bias without complicated analysis.
Download the Slope Direction Line Indicator from IndicatorForest.com today and gain an edge in Forex trading by accurately identifying market trends and potential reversal zones.
FAQ
The Slope Direction Line plots a colored line based on linear regression that changes according to market bias—light blue for bullish conditions and red for bearish. It gives a quick visual read of the current trend direction.
Many traders consider buying when price is above an upward‑sloping blue line and selling when price is below a downward‑sloping red line. A change in line color or slope can act as an early warning to tighten stops or close a position.
The indicator can be applied to any MT4 timeframe, but higher charts like H1, H4 or Daily often produce smoother, more reliable trends. Lower timeframes are faster but more sensitive to noise.
It is safer to treat color flips as alerts rather than automatic trade commands. Confirm changes with price action, support and resistance or oscillators to avoid reacting to minor, short‑lived pullbacks.
RSI, MACD, stochastic oscillators and simple horizontal levels work well to confirm the trend shown by the slope line. Together they help you judge both direction and the quality of each potential setup.
2 Downloads
Published:
Dec 18, 2025 02:35 AM
Category: