Maximizing Reversal Precision with the Slow KD RSI Indicator
In modern technical analysis, momentum oscillators are indispensable for pinpointing overextended market conditions and catching major trend pivots. However, trading with a single oscillator often leaves retail traders vulnerable to structural vulnerabilities. A standard Relative Strength Index (RSI) can remain embedded in overbought or oversold territory for long periods during strong trends, while a fast Stochastic oscillator frequently yields choppy, premature entry signals. The Slow KD RSI Indicator solves this dilemma for MetaTrader users by combining two legendary momentum formulas into a singular, synchronized execution engine.
The Confluence of Slow Stochastic (KD) and RSI Math
To appreciate the predictive accuracy of this tool, it is important to understand the mechanics of its dual-indicator design:
- The Relative Strength Index (RSI): Measures the velocity and magnitude of directional price movements, grading underlying structural strength on a scale of $0$ to $100$.
- The Slow Stochastic (KD) Engine: Tracks the closing price of an asset relative to its high-low range over a specified period. The "Slow" variation applies an extra layer of internal smoothing ($\%K$ and $\%D$ lines) to eliminate the erratic market static common in raw momentum feeds.
Rather than forcing you to look at two separate indicator windows, the Slow KD RSI indicator cross-filters these calculations on the backend. By demanding mathematical agreement between the cyclical nature of Stochastics and the structural exhaustion of the RSI, it screens out weak counter-trend spikes and highlights high-probability structural turning points.
Navigating the Visual Oscillation Framework
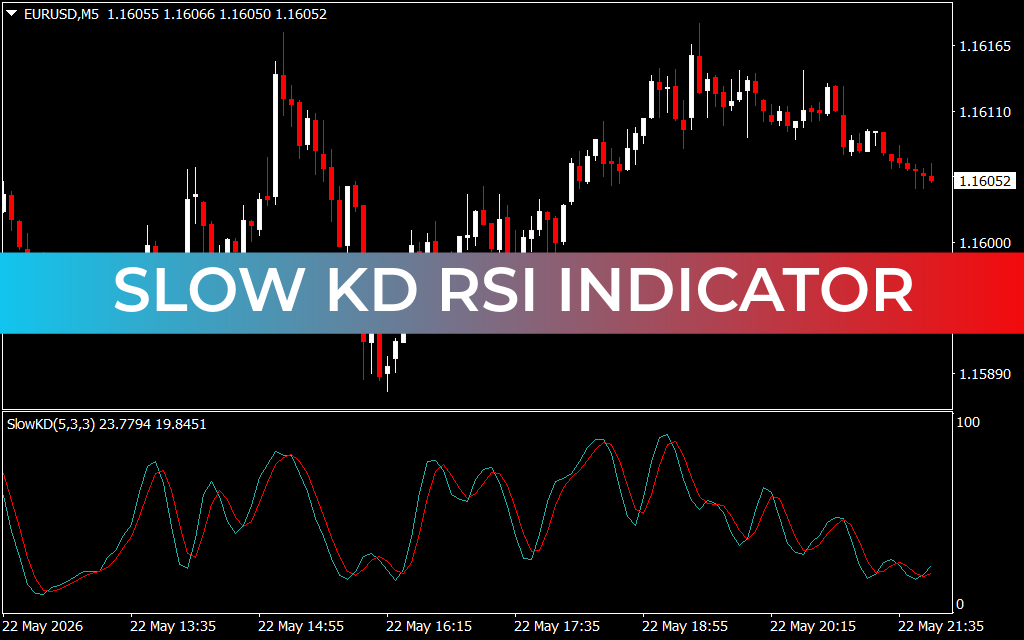
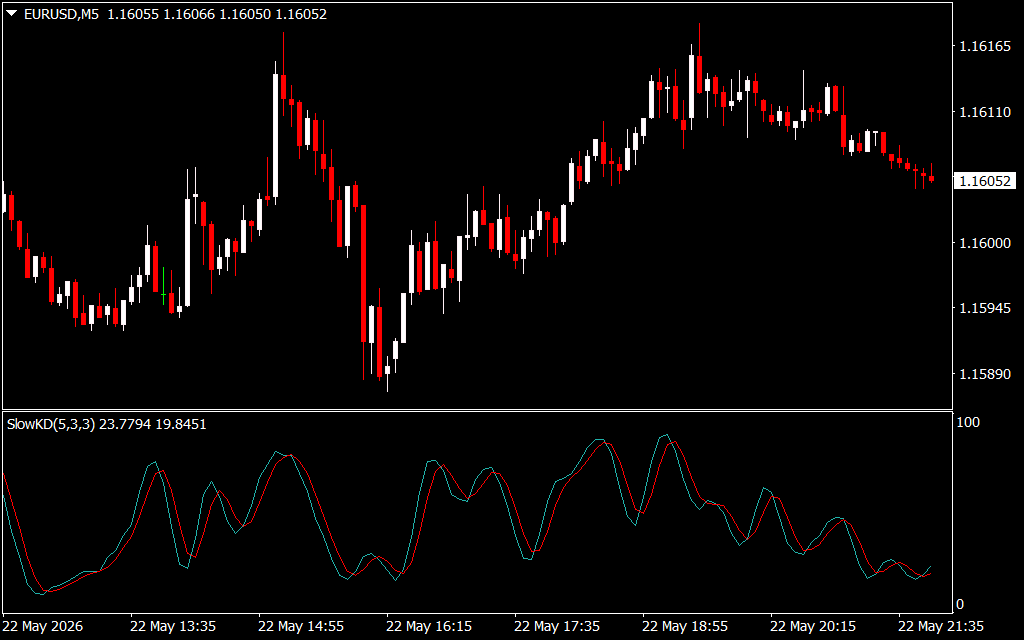
As displayed on the EURUSD 5-minute (M5) chart, the indicator shifts complex data into a highly responsive sub-window pane. The SlowKD(5,3,3) tracking matrix utilizes a clean dual-line system that moves fluidly across a standard $0$ to $100$ scale:
- The Light Blue Line ($\%K$): Represents the fast-tracking momentum component, registering immediate changes in buying and selling velocity.
- The Red Line ($\%D$): Acts as the smoothed signal baseline, anchoring the overall direction of intraday market waves.
The most potent trade configurations occur when these lines cross over near the extreme statistical boundaries. When the lines climb above the $80$ line, a bearish crossover where the blue line breaks below the red line confirms that buyers are exhausted. Conversely, when the lines plunge below the $20$ threshold—as seen during the deep corrective troughs on the attached M5 chart—a clean bullish crossover indicates that short-term liquidations have dried up, clearing the path for an institutional reversal.
Building an Objective Mechanical Strategy
The Slow KD RSI indicator serves as an exceptional standalone execution trigger or as a high-confluence filter within a multi-timeframe system. For intraday scalpers and day traders, a reliable approach involves waiting for price to test a major institutional supply or demand level.
Once price tests the key zone, you simply check the sub-window: if the Slow KD RSI lines print a synchronized crossover inside an extreme valuation pocket, it delivers a highly objective, tight-risk entry signal. By removing emotional guesswork from momentum trading, this tool allows you to protect your capital and execute your edge with mechanical discipline.
2 Downloads
Last Update:
May 24, 2026 02:16 AM
Published:
Jan 15, 2026 19:56 PM
Category: