Master Trend Reversals with the SM Price Bend Indicator
In the world of technical analysis, spotting the exact moment a trend begins to curve or "bend" is the difference between catching a massive wave and being wiped out by a reversal. The SM Price Bend Indicator is a premier momentum tool for MetaTrader 4 and 5 designed to identify these critical shifts in market sentiment before they become obvious on the price chart.
What is the SM Price Bend Indicator?
The SM Price Bend is a specialized oscillator that tracks price velocity and curvature. Unlike standard indicators that simply follow price, this tool measures the "bend" in momentum. It identifies when Price Action is losing its linear strength and beginning to rotate, signaling an imminent change in direction.
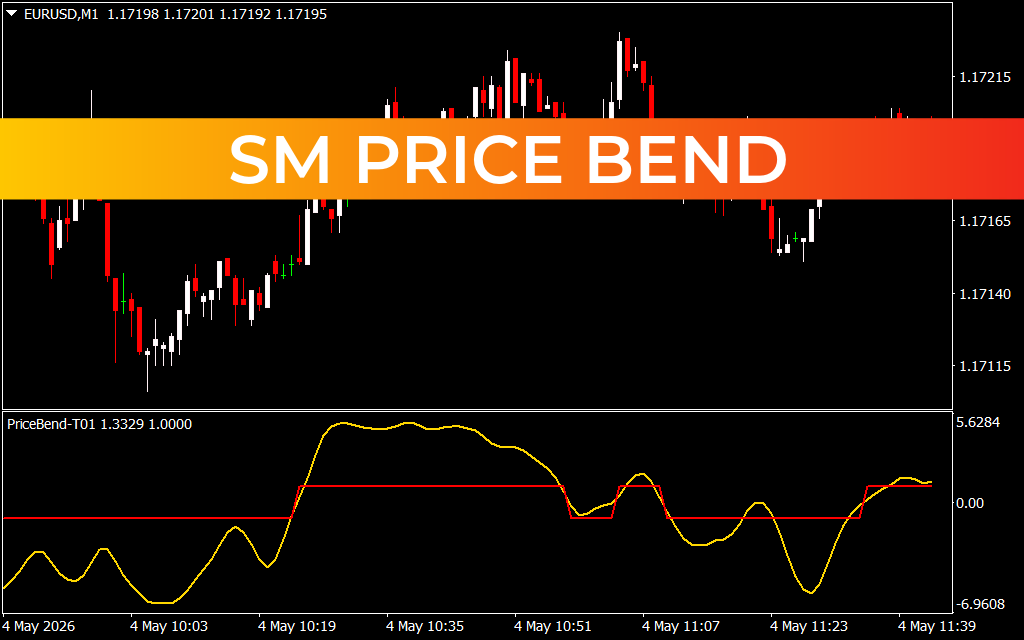
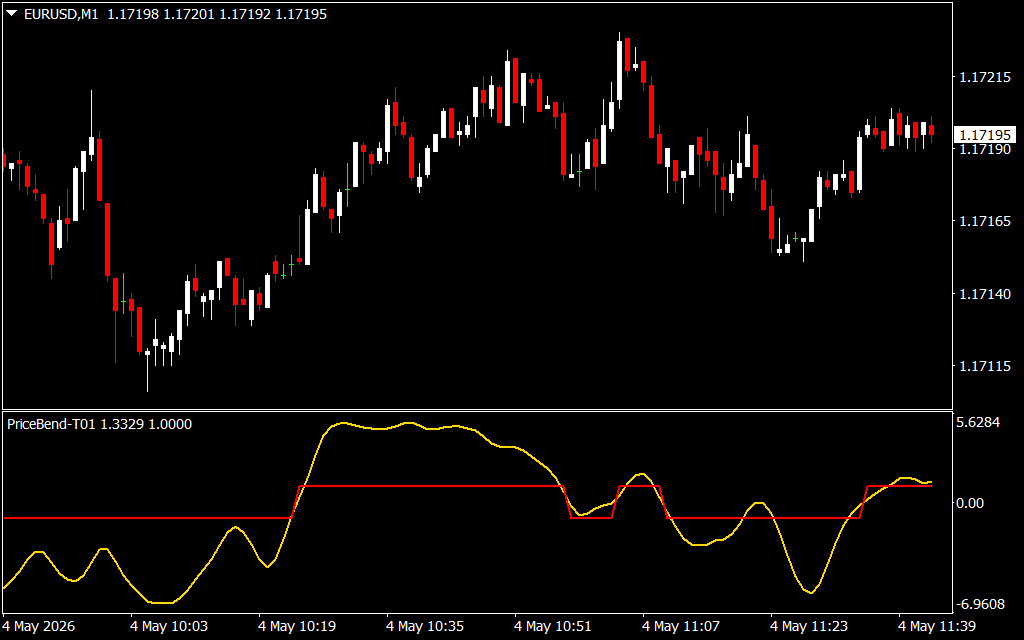
As seen in the provided EUR/USD M1 chart, the indicator features a dynamic yellow signal line and a horizontal red threshold line. By monitoring the interaction between these two components, traders can visualize the underlying "health" of a trend.
How to Trade with SM Price Bend
The indicator provides clear, rule-based signals that remove the emotional guesswork from trading:
- Bullish Momentum (Crossing Above 0.00): When the yellow signal line crosses above the red threshold into positive territory, it indicates that the downward "bend" has ended and bullish momentum is taking charge.
- Bearish Momentum (Crossing Below 0.00): When the yellow line drops below the red threshold, it signals that the upward trend is curving downward, suggesting a potential short entry.
- Momentum Surges: Large peaks in the yellow line indicate high-velocity price movements. When the yellow line begins to "flatten out" or head back toward the red line, it’s a warning that the current move is exhausted.
Why It’s a Scalper’s Best Friend
For traders operating on the M1 or M5 timeframes, "noise" is the greatest enemy. The SM Price Bend Indicator utilizes a smoothing algorithm (the "SM" in its name) to filter out minor price flickers while remaining responsive to genuine shifts. This makes it an exceptional tool for scalpers who need to identify quick entries and exits during high-volatility sessions.
By identifying the "bend" in price, scalpers can exit trades exactly as the momentum begins to fade, maximizing profit capture and minimizing exposure to retracements.
Strategy Integration
The SM Price Bend is most powerful when used alongside structural price action. For instance, if price hits a major resistance zone and the SM Price Bend shows a sharp downward curve crossing the red line, you have a high-probability confluence signal for a short trade.
It also serves as an excellent filter for trend-following systems. If your primary system gives a "buy" signal, but the SM Price Bend is still trending downward below the red line, it may be wise to wait for the indicator to confirm the "bend" upward before entering.
Conclusion
The SM Price Bend Indicator offers a unique perspective on market dynamics by focusing on the transition phases of price movement. It turns complex momentum calculations into a simple, visual map of trend health. Download it today to enhance your MT4/MT5 platform and start catching market turns with professional-grade precision
4 Downloads
Last Update:
May 04, 2026 14:44 PM
Published:
Jan 28, 2026 02:40 AM
Category: